## Chart: Correlation Amplitude vs. Order
### Overview
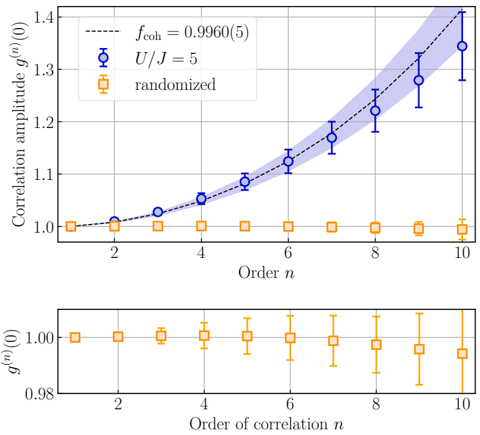
The image contains two line plots showing the correlation amplitude g^(n)(0) as a function of the order 'n'. The top plot displays two data series: one for U/J = 5, which shows an increasing trend, and another for randomized data, which remains relatively constant. The bottom plot shows a zoomed-in view of the randomized data.
### Components/Axes
**Top Plot:**
* **Y-axis:** Correlation amplitude g^(n)(0), ranging from 1.0 to 1.4.
* **X-axis:** Order n, ranging from 1 to 10.
* **Legend (top-left):**
* Black dashed line: f_coh = 0.9960(5)
* Blue circles: U/J = 5
* Orange squares: randomized
**Bottom Plot:**
* **Y-axis:** g^(n)(0), ranging from 0.98 to 1.00.
* **X-axis:** Order of correlation n, ranging from 1 to 10.
* **Data:** Orange squares, corresponding to the "randomized" data from the top plot.
### Detailed Analysis
**Top Plot:**
* **f_coh = 0.9960(5) (Black dashed line):** This line represents a theoretical curve. It starts at approximately 1.0 and increases with 'n'. A shaded blue region surrounds this line, indicating uncertainty.
* n=1: g^(n)(0) ≈ 1.0
* n=2: g^(n)(0) ≈ 1.0
* n=4: g^(n)(0) ≈ 1.04
* n=6: g^(n)(0) ≈ 1.1
* n=8: g^(n)(0) ≈ 1.22
* n=10: g^(n)(0) ≈ 1.35
* **U/J = 5 (Blue circles):** This data series shows a clear increasing trend. Error bars are present at each data point.
* n=1: g^(n)(0) ≈ 1.0, error bar ±0.01
* n=2: g^(n)(0) ≈ 1.02, error bar ±0.01
* n=3: g^(n)(0) ≈ 1.04, error bar ±0.01
* n=4: g^(n)(0) ≈ 1.09, error bar ±0.01
* n=5: g^(n)(0) ≈ 1.12, error bar ±0.01
* n=6: g^(n)(0) ≈ 1.13, error bar ±0.01
* n=7: g^(n)(0) ≈ 1.22, error bar ±0.02
* n=8: g^(n)(0) ≈ 1.23, error bar ±0.02
* n=9: g^(n)(0) ≈ 1.32, error bar ±0.03
* n=10: g^(n)(0) ≈ 1.35, error bar ±0.05
* **Randomized (Orange squares):** This data series remains relatively constant around 1.0. Error bars are present at each data point.
* n=1: g^(n)(0) ≈ 1.0, error bar ±0.01
* n=2: g^(n)(0) ≈ 1.0, error bar ±0.01
* n=3: g^(n)(0) ≈ 1.0, error bar ±0.01
* n=4: g^(n)(0) ≈ 1.0, error bar ±0.01
* n=5: g^(n)(0) ≈ 1.0, error bar ±0.01
* n=6: g^(n)(0) ≈ 1.0, error bar ±0.01
* n=7: g^(n)(0) ≈ 1.0, error bar ±0.01
* n=8: g^(n)(0) ≈ 1.0, error bar ±0.01
* n=9: g^(n)(0) ≈ 1.0, error bar ±0.01
* n=10: g^(n)(0) ≈ 1.0, error bar ±0.01
**Bottom Plot:**
* This plot provides a zoomed-in view of the "randomized" data, allowing for a closer examination of its fluctuations around 1.0. The error bars are more visible in this plot.
### Key Observations
* The correlation amplitude for U/J = 5 increases significantly with the order 'n'.
* The correlation amplitude for the randomized data remains relatively constant around 1.0.
* The theoretical curve (f_coh = 0.9960(5)) closely follows the trend of the U/J = 5 data.
* The error bars for the randomized data in the bottom plot show the degree of fluctuation around 1.0.
### Interpretation
The data suggests that the system with U/J = 5 exhibits increasing correlations as the order 'n' increases, indicating a stronger dependence on higher-order correlations. In contrast, the randomized data shows no such trend, suggesting a lack of significant higher-order correlations. The theoretical curve provides a model that aligns well with the U/J = 5 data, supporting the theoretical framework. The randomized data serves as a baseline, demonstrating the absence of correlation effects in a disordered system. The error bars provide a measure of the uncertainty in the measurements.