## Chart: Correlation Amplitude vs. Order $n$
### Overview
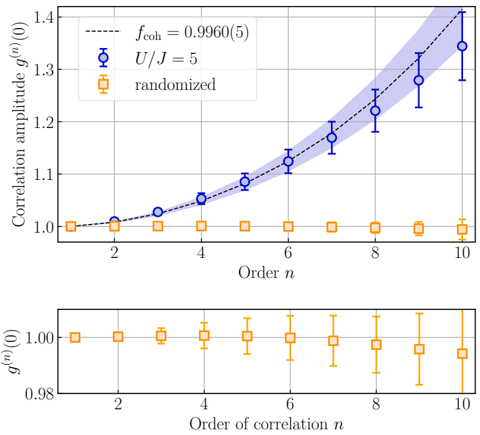
The image consists of two vertically stacked plots analyzing the correlation amplitude $g^{(n)}(0)$ as a function of the correlation order $n$ (ranging from 1 to 10). The top plot compares a physical system with interaction strength $U/J = 5$ against a "randomized" control group. The bottom plot provides a detailed, zoomed-in view of the "randomized" data series to illustrate its variance.
### Components/Axes
**Top Plot:**
* **Y-Axis:** "Correlation amplitude $g^{(n)}(0)$". Scale ranges from 1.0 to 1.4.
* **X-Axis:** "Order $n$". Scale ranges from 1 to 10.
* **Legend (Positioned top-left):**
* **Dashed line:** $f_{\text{coh}} = 0.9960(5)$
* **Blue circles:** $U/J = 5$
* **Orange squares:** "randomized"
* **Visual Elements:** A dashed line with a shaded blue error region follows the blue circles.
**Bottom Plot:**
* **Y-Axis:** "$g^{(n)}(0)$". Scale ranges from 0.98 to 1.00.
* **X-Axis:** "Order of correlation $n$". Scale ranges from 1 to 10.
* **Data Series:** Orange squares (representing the "randomized" data).
### Detailed Analysis
**Top Plot Trends:**
* **Blue Circles ($U/J = 5$):** The data series exhibits a clear, non-linear, upward-curving (convex) trend.
* At $n=1$, the value is approximately 1.0.
* The values increase progressively: $n=2 (\approx 1.01)$, $n=4 (\approx 1.05)$, $n=6 (\approx 1.12)$, $n=8 (\approx 1.22)$, and $n=10 (\approx 1.35)$.
* The error bars for this series are relatively consistent in size across all orders.
* **Dashed Line ($f_{\text{coh}}$):** This line acts as a fit or theoretical model, closely tracking the blue circles. The shaded blue region represents the uncertainty of this fit.
* **Orange Squares (randomized):** This series remains flat, consistently centered at $y = 1.0$ across all orders $n=1$ to $n=10$.
**Bottom Plot Trends:**
* **Orange Squares (randomized):** This plot isolates the randomized data to show the behavior of the error bars.
* The mean value remains approximately 1.0 for $n=1$ through $n=6$.
* From $n=7$ to $n=10$, the mean value shows a slight downward drift (reaching approximately 0.995 at $n=10$).
* **Uncertainty:** There is a distinct trend of increasing variance. The error bars are negligible at $n=1$ and $n=2$, but grow significantly larger as $n$ increases, indicating that the statistical uncertainty of the randomized measurement increases with the order of correlation.
### Key Observations
* **Correlation Growth:** The $U/J=5$ system demonstrates significant growth in correlation amplitude as the order $n$ increases, deviating sharply from the randomized baseline.
* **Baseline Stability:** The "randomized" data serves as a control, maintaining a mean value near 1.0, which is characteristic of uncorrelated (Poissonian) statistics.
* **Variance Divergence:** The bottom plot reveals that while the randomized data is centered at 1.0, the precision of this measurement degrades as the order $n$ increases, evidenced by the expanding error bars.
### Interpretation
This data is characteristic of quantum optics or condensed matter physics, specifically experiments involving the Bose-Hubbard model or similar systems where $U$ (interaction energy) and $J$ (tunneling amplitude) are defined.
* **Physical Significance:** The $g^{(n)}(0)$ function represents the $n$-th order correlation function. A value of 1.0 (as seen in the randomized data) typically indicates a coherent or thermal state with no correlations (Poissonian statistics). The upward trend of the $U/J=5$ data indicates "bunching" or strong quantum correlations that become more pronounced at higher orders.
* **Experimental Limitations:** The bottom plot is crucial for understanding the experimental noise floor. The increasing error bars suggest that higher-order correlation measurements are inherently more susceptible to statistical noise or experimental instability. The researchers likely included this sub-plot to demonstrate that the observed growth in the $U/J=5$ data is statistically significant and not an artifact of increasing measurement uncertainty.