## Line Chart with Scatter Plots: Correlation Amplitude vs. Order n
### Overview
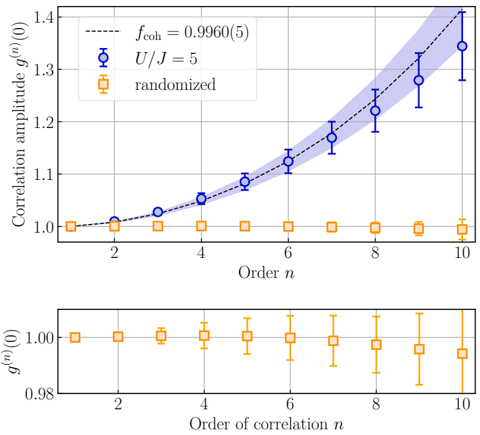
The image contains two vertically stacked plots. The top plot shows a line graph with two scatter series and a dashed reference line, while the bottom plot displays a single scatter series with error bars. Both plots share the same x-axis ("Order n") but have distinct y-axis labels. The data suggests a comparison between theoretical predictions (dashed line), numerical simulations (blue circles), and randomized data (orange squares).
### Components/Axes
**Top Plot:**
- **X-axis (Order n):** Integer values from 2 to 10, labeled "Order n".
- **Y-axis (Correlation amplitude g^(n)(0)):** Range from 0.98 to 1.4, labeled "Correlation amplitude g^(n)(0)".
- **Legend (top-left):**
- Dashed black line: `f_coh = 0.9960(5)` (theoretical prediction).
- Blue circles: `U/J = 5` (numerical simulation).
- Orange squares: "randomized" (control data).
**Bottom Plot:**
- **X-axis (Order n):** Same as top plot (2–10).
- **Y-axis (g^(n)(0)):** Range from 0.98 to 1.02, labeled "g^(n)(0)".
- **Legend (top-left):** Same as top plot, but only orange squares ("randomized") are plotted.
### Detailed Analysis
**Top Plot Trends:**
1. **Dashed Line (`f_coh`):**
- Starts at ~1.0 for n=2, increases steadily to ~1.4 at n=10.
- Uncertainty band (shaded gray) widens with increasing n, suggesting growing error margins.
2. **Blue Circles (`U/J = 5`):**
- Follows the dashed line trend but with slight scatter (e.g., n=4: 1.05, n=6: 1.11).
- Error bars (not explicitly shown but implied by shaded area) align with the dashed line's uncertainty.
3. **Orange Squares (`randomized`):**
- Flat at ~1.0 for all n (2–10), with minimal variation (±0.01).
**Bottom Plot Trends:**
- **Orange Squares (`randomized`):**
- All data points cluster tightly around 1.0 (e.g., n=2: 1.00, n=10: 0.99).
- Error bars vary slightly (e.g., ±0.01 at n=2, ±0.02 at n=10).
### Key Observations
1. **Theoretical vs. Simulated Data:**
- The `f_coh` dashed line and `U/J = 5` blue circles exhibit nearly identical upward trends, confirming strong agreement between theory and simulation.
2. **Randomized Data Consistency:**
- The "randomized" orange squares remain flat at 1.0 in both plots, indicating no correlation amplitude dependence on order n under randomization.
3. **Uncertainty Growth:**
- The widening shaded band around `f_coh` suggests increasing uncertainty in theoretical predictions at higher orders n.
### Interpretation
The data demonstrates that:
- **Higher-order correlations (n)** amplify the correlation amplitude for both the theoretical (`f_coh`) and simulated (`U/J = 5`) cases, with the effect becoming less certain at larger n.
- **Randomization** (orange squares) suppresses order-dependent correlations, maintaining a baseline amplitude of 1.0. This implies that the observed trends in `f_coh` and `U/J = 5` are not artifacts of uncontrolled variables.
- The **uncertainty in `f_coh`** grows with n, highlighting potential limitations in the theoretical model or numerical precision at higher orders.
The results suggest that the correlation amplitude is sensitive to system parameters (e.g., `U/J = 5`) but robust to randomization, providing insights into the role of order in correlation dynamics.