\n
## Diagram: Phase Space Representation
### Overview
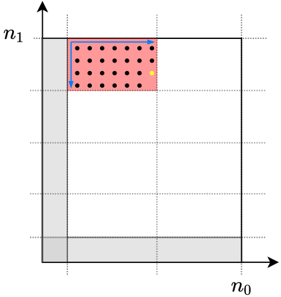
The image depicts a two-dimensional phase space diagram, likely representing a system's state based on two variables, n₀ and n₁. A rectangular region within the phase space is highlighted with a red fill containing black dots, and is bordered by a blue rectangle with arrows indicating a direction of movement. The diagram appears to illustrate a specific region of accessible states or a trajectory within the phase space.
### Components/Axes
* **Axes:** The diagram has two axes labeled n₀ (horizontal) and n₁ (vertical). The axes appear to be linearly scaled, with no explicit numerical values indicated.
* **Highlighted Region:** A rectangular region in the top-left quadrant is filled with red dots. This region is enclosed by a blue rectangle.
* **Arrows:** Two blue arrows are present along the sides of the blue rectangle, indicating a direction of movement or flow. One arrow points upwards, and the other points to the right.
* **Shaded Areas:** The areas to the right of the n₁ axis and below the n₀ axis are shaded in gray.
### Detailed Analysis
The diagram shows a rectangular region in the n₀-n₁ phase space. The red dots within the rectangle suggest discrete states or points within that region. The blue rectangle outlines the region, and the arrows indicate a possible trajectory or flow direction within that region. The shaded areas represent regions of the phase space that are not currently considered or are inaccessible.
The dimensions of the rectangle are approximately 2 units along the n₀ axis and 3 units along the n₁ axis. The red dots appear to be randomly distributed within the rectangle, with an approximate density of 15-20 dots per unit area. The arrows are approximately the same length as the sides of the rectangle.
### Key Observations
* The diagram focuses on a specific region of the phase space, defined by the blue rectangle.
* The red dots suggest a set of discrete states within that region.
* The arrows indicate a direction of movement or flow within the region.
* The shaded areas represent regions outside the current focus.
### Interpretation
This diagram likely represents a system's behavior in a two-dimensional phase space. The n₀ and n₁ variables could represent any two relevant state variables of the system (e.g., position and momentum, concentration of two species). The red dots represent possible states of the system, and the blue rectangle defines a region of interest. The arrows suggest that the system is evolving or moving within this region, potentially following a specific trajectory.
The shaded areas could represent regions of the phase space that are energetically unfavorable or inaccessible to the system under the given conditions. The diagram could be used to illustrate the dynamics of a system, the stability of certain states, or the possible pathways the system can take. The lack of numerical values on the axes suggests that the diagram is intended to be a qualitative representation of the system's behavior rather than a precise quantitative analysis. The diagram is a conceptual illustration of a system's state and its evolution in phase space.