## Diagram: 2D Coordinate System with Highlighted Region
### Overview
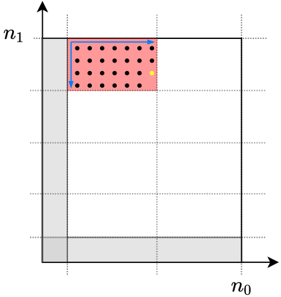
The image is a technical diagram illustrating a two-dimensional coordinate system with axes labeled `n0` and `n1`. A specific rectangular region within this space is highlighted in pink and contains a grid of data points. The diagram appears to represent a conceptual space, possibly for sampling, classification, or defining a region of interest.
### Components/Axes
* **Axes:**
* **Horizontal Axis (X-axis):** Labeled `n0` at the bottom-right corner. An arrow points to the right, indicating the positive direction.
* **Vertical Axis (Y-axis):** Labeled `n1` at the top-left corner. An arrow points upward, indicating the positive direction.
* **Grid:** A grid of dotted lines divides the visible coordinate space into a 4x4 arrangement of rectangular cells.
* **Shaded Regions:**
* A light gray shaded area runs along the bottom of the diagram, spanning the full width of the visible `n0` axis.
* A light gray shaded area runs along the left side of the diagram, spanning the full height of the visible `n1` axis.
* **Highlighted Region:** A pink-shaded rectangle is positioned in the upper-left quadrant of the grid. Its boundaries align with the grid lines.
* **Data Points:** Within the pink rectangle, there is a regular 5x5 grid of small black dots. Additionally, two distinct colored dots are present:
* A **blue dot** is located at the top-right corner of the pink rectangle's dot grid.
* A **yellow dot** is located at the bottom-right corner of the pink rectangle's dot grid.
### Detailed Analysis
* **Spatial Grounding & Positioning:**
* The pink rectangle is bounded on the left by the vertical grid line adjacent to the left gray shaded area and on the top by the horizontal grid line just below the `n1` axis label.
* The blue dot is positioned at the intersection of the top and right boundaries of the pink rectangle's internal dot grid.
* The yellow dot is positioned at the intersection of the bottom and right boundaries of the pink rectangle's internal dot grid.
* **Component Isolation:**
* **Header Region:** Contains the `n1` axis label and the upward-pointing arrow.
* **Main Chart Region:** Contains the coordinate grid, the two gray shaded axes regions, the pink rectangle, and all data points.
* **Footer Region:** Contains the `n0` axis label and the rightward-pointing arrow.
### Key Observations
1. The diagram defines a specific, bounded sub-region (the pink rectangle) within a larger 2D space (`n0`, `n1`).
2. The regular grid of black dots suggests systematic sampling or a discrete set of points within this region of interest.
3. The blue and yellow dots are visually distinct outliers within the pattern, placed at specific corners of the sampling grid. Their color differentiation implies they represent special cases, initial/final points, or different categories compared to the black dots.
4. The gray shaded areas along the axes may represent boundary conditions, excluded zones, or axes of symmetry.
### Interpretation
This diagram is likely a conceptual illustration rather than a plot of empirical data. It visually communicates the idea of defining a **region of interest** (the pink rectangle) within a parameter space defined by variables `n0` and `n1`. The internal grid of dots represents a **discrete sampling** of that region.
The colored dots (blue and yellow) serve as **visual anchors or markers**. Their placement at opposite corners of the sampling grid could symbolize:
* **Extremes:** The minimum and maximum points along a diagonal.
* **Start and End Points:** For a process or traversal within the region.
* **Class Representatives:** If the diagram relates to machine learning, they could be prototype points for different classes within the highlighted region.
The gray axes shading reinforces the idea that the pink region is a subset of the full space, potentially indicating that values near the axes (`n0 ≈ 0` or `n1 ≈ 0`) are treated differently or excluded from the primary analysis area. The overall message is about focusing on a specific, structured subset of a broader two-dimensional domain.