## Diagram: Grid with Highlighted Region and Movement Path
### Overview
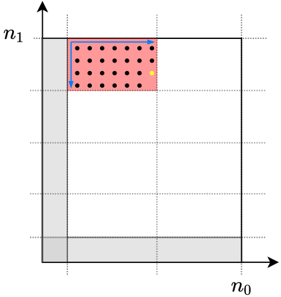
The image depicts a 2D grid system with labeled axes (`n₀` and `n₁`) and a highlighted rectangular region in the top-left quadrant. A path with directional arrows is overlaid on the grid, indicating movement from the bottom-left to the top-right corner of the highlighted area. A yellow dot is positioned centrally within the highlighted region.
### Components/Axes
- **Axes**:
- Horizontal axis labeled `n₀` (rightward direction).
- Vertical axis labeled `n₁` (upward direction).
- **Grid**:
- Fine grid lines divide the space into discrete cells.
- Highlighted region: A red rectangle spanning approximately 10 grid cells horizontally (`n₀`) and 5 grid cells vertically (`n₁`).
- **Path**:
- Blue arrows form a diagonal trajectory from the bottom-left to the top-right of the highlighted region.
- Arrows suggest sequential movement or progression.
- **Markers**:
- Black dots densely populate the highlighted region.
- A single yellow dot is centered within the highlighted area.
### Detailed Analysis
- **Grid Structure**:
- The grid extends beyond the highlighted region, but no additional labels or markers are present outside the red rectangle.
- The highlighted region occupies the top-left quadrant, bounded by `n₀` (0–10) and `n₁` (0–5).
- **Path Interpretation**:
- The blue arrows imply a directional flow or process occurring within the highlighted area.
- The path’s slope is approximately 1:2 (vertical:horizontal), suggesting a moderate upward trajectory.
- **Markers**:
- Black dots may represent discrete data points or nodes within the region.
- The yellow dot’s central position could indicate a focal point or reference value.
### Key Observations
1. **No Textual Labels**: No axis titles, legends, or numerical values are visible in the image.
2. **Spatial Relationships**:
- The highlighted region is tightly bounded, with the path confined to its interior.
- The yellow dot’s placement suggests it is a critical or distinct element within the region.
3. **Ambiguity in Scale**:
- Grid cell size is uniform but unquantified (e.g., no units or numerical increments).
- The exact dimensions of the highlighted region cannot be determined without additional context.
### Interpretation
This diagram likely represents a **coordinate-based system** or **spatial process** within a defined region. The highlighted area and directional path suggest a focus on movement, progression, or interaction within a bounded space. The absence of textual labels or numerical data implies the diagram is either:
- A conceptual illustration (e.g., workflow, navigation, or spatial analysis).
- A placeholder for a larger dataset or model.
- A simplified representation for educational or diagrammatic purposes.
The yellow dot’s central position may denote a key node, equilibrium point, or target value. The black dots could represent discrete events, measurements, or nodes in a network. Without additional context, the diagram’s purpose remains open to interpretation, but its structure emphasizes spatial relationships and directional flow.