## Donut Chart: Overall Attack Prevention
### Overview
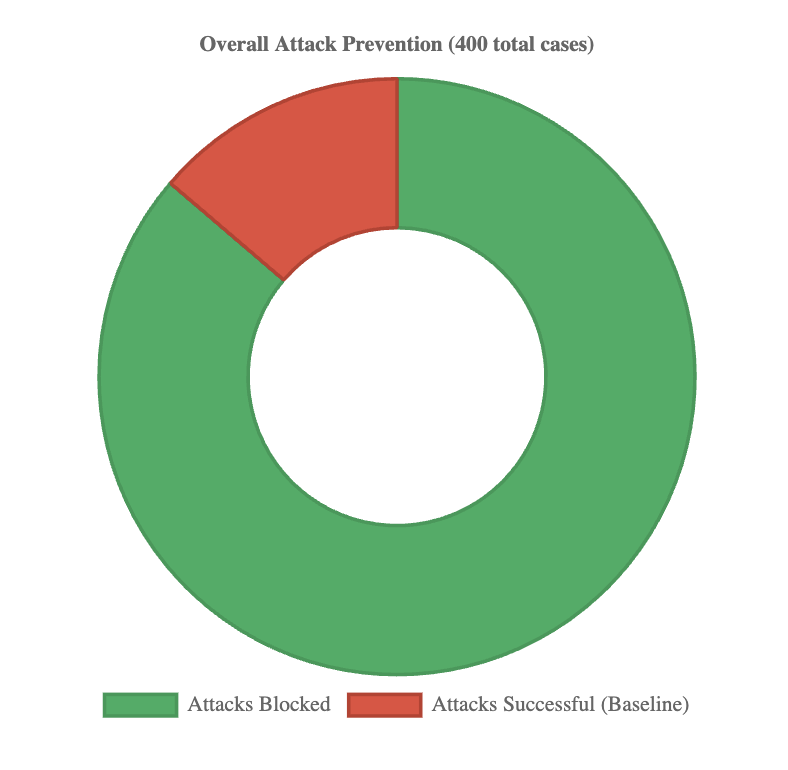
The image is a donut chart illustrating the overall attack prevention, based on 400 total cases. The chart is divided into two categories: "Attacks Blocked" (represented in green) and "Attacks Successful (Baseline)" (represented in red). The green section occupies a significantly larger portion of the chart than the red section.
### Components/Axes
* **Title:** Overall Attack Prevention (400 total cases)
* **Categories:**
* Attacks Blocked (Green)
* Attacks Successful (Baseline) (Red)
* **Legend:** Located at the bottom of the chart.
* Green square: Attacks Blocked
* Red square: Attacks Successful (Baseline)
### Detailed Analysis
The donut chart visually represents the proportion of attacks blocked versus attacks that were successful. The green section, representing "Attacks Blocked," appears to occupy approximately 75-80% of the chart. The red section, representing "Attacks Successful (Baseline)," occupies the remaining 20-25%.
* **Attacks Blocked (Green):** Occupies the majority of the donut chart, approximately 75-80%. This suggests that a large proportion of attacks were successfully blocked. Given the total of 400 cases, this translates to roughly 300-320 attacks blocked.
* **Attacks Successful (Baseline) (Red):** Occupies a smaller portion of the donut chart, approximately 20-25%. This suggests that a smaller proportion of attacks were successful. Given the total of 400 cases, this translates to roughly 80-100 successful attacks.
### Key Observations
* The vast majority of attacks were blocked, as indicated by the large green section of the donut chart.
* A smaller, but still significant, number of attacks were successful, as indicated by the red section of the donut chart.
### Interpretation
The donut chart indicates a relatively high success rate in blocking attacks. The "Attacks Blocked" category significantly outweighs the "Attacks Successful (Baseline)" category, suggesting that the attack prevention measures are effective. However, the presence of successful attacks indicates that there is still room for improvement in the attack prevention strategy. The chart provides a clear visual representation of the effectiveness of the attack prevention system, highlighting both its successes and areas for potential enhancement.