# Technical Document Extraction: Overall Attack Prevention Chart
## Chart Overview
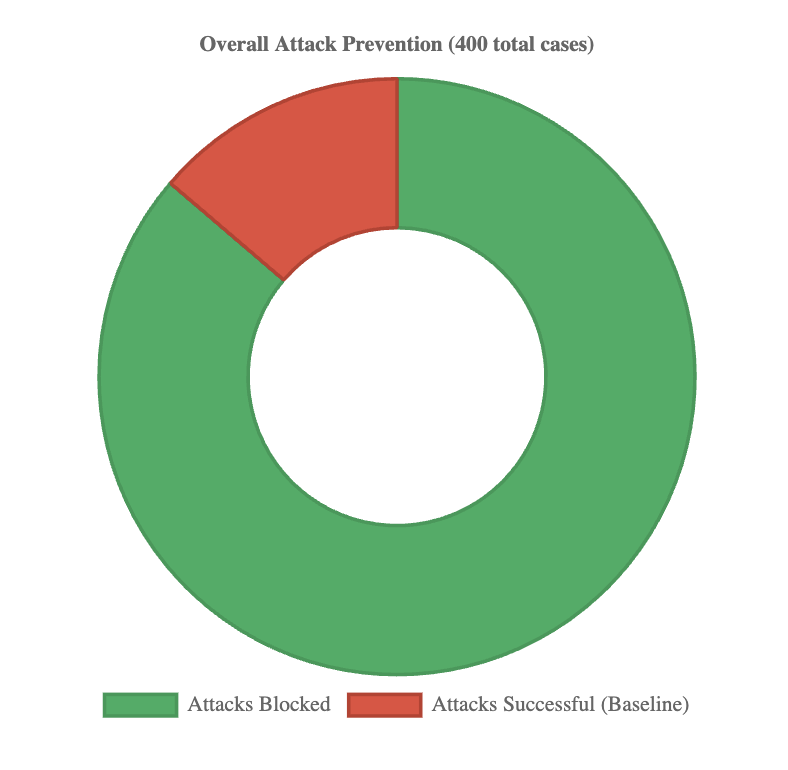
- **Title**: Overall Attack Prevention (400 total cases)
- **Type**: Pie Chart
- **Total Cases**: 400
## Legend
- **Location**: Bottom of chart
- **Color-Coding**:
- **Green**: Attacks Blocked
- **Red**: Attacks Successful (Baseline)
## Data Segmentation
1. **Attacks Blocked** (Green)
- **Percentage**: 80% (visually dominant segment)
- **Absolute Value**: 320 cases (80% of 400)
2. **Attacks Successful (Baseline)** (Red)
- **Percentage**: 20% (smaller segment)
- **Absolute Value**: 80 cases (20% of 400)
## Spatial Grounding
- **Legend Position**: Bottom-center alignment
- **Data Point Verification**:
- Green segment matches "Attacks Blocked" label
- Red segment matches "Attacks Successful (Baseline)" label
## Trend Analysis
- **Dominance of Blocked Attacks**:
- Green segment occupies 80% of the chart, visually confirming 5:1 ratio over red
- Red segment represents baseline success rate at 20%
- **Implication**: Prevention system successfully blocks 80% of attacks, with baseline success rate at 20%
## Component Isolation
1. **Header**: Chart title with total case count
2. **Main Chart**:
- Circular pie chart with two distinct segments
- No additional annotations or sub-labels
3. **Footer**: Legend with color-coded categories
## Data Table Reconstruction
| Category | Percentage | Absolute Value |
|---------------------------|------------|----------------|
| Attacks Blocked | 80% | 320 |
| Attacks Successful (Baseline) | 20% | 80 |
## Validation Checks
1. **Legend Accuracy**: Colors match segment colors exactly
2. **Percentage Sum**: 80% + 20% = 100% (validates data integrity)
3. **Absolute Values**: 320 + 80 = 400 (matches total case count)