# Technical Document Extraction: LLM Benchmark Performance Comparison
## 1. Component Isolation
* **Header/Legend:** Located at the top of the image, spanning the width. It contains six color-coded labels for the models being compared.
* **Main Chart:** A grouped bar chart showing performance across six different benchmarks.
* **Y-Axis:** Located on the left, representing "Accuracy / Percentile (%)".
* **X-Axis:** Located at the bottom, representing six specific benchmark categories with their respective metrics in parentheses.
---
## 2. Legend and Model Identification
The legend is positioned at the top of the chart. Each model is represented by a specific color and pattern:
| Model Name | Color/Pattern Description |
| :--- | :--- |
| **DeepSeek-V3** | Royal Blue with white diagonal stripes (hatching) |
| **DeepSeek-V2.5** | Light Blue (solid) |
| **Qwen2.5-72B-Inst** | Medium Grey (solid) |
| **Llama-3.1-405B-Inst** | Light Grey (solid) |
| **GPT-4o-0513** | Tan/Beige (solid) |
| **Claude-3.5-Sonnet-1022** | Cream/Off-white (solid) |
---
## 3. Data Table Reconstruction
The following table extracts the numerical data points displayed above each bar in the chart.
| Benchmark (Metric) | DeepSeek-V3 | DeepSeek-V2.5 | Qwen2.5-72B-Inst | Llama-3.1-405B-Inst | GPT-4o-0513 | Claude-3.5-Sonnet-1022 |
| :--- | :---: | :---: | :---: | :---: | :---: | :---: |
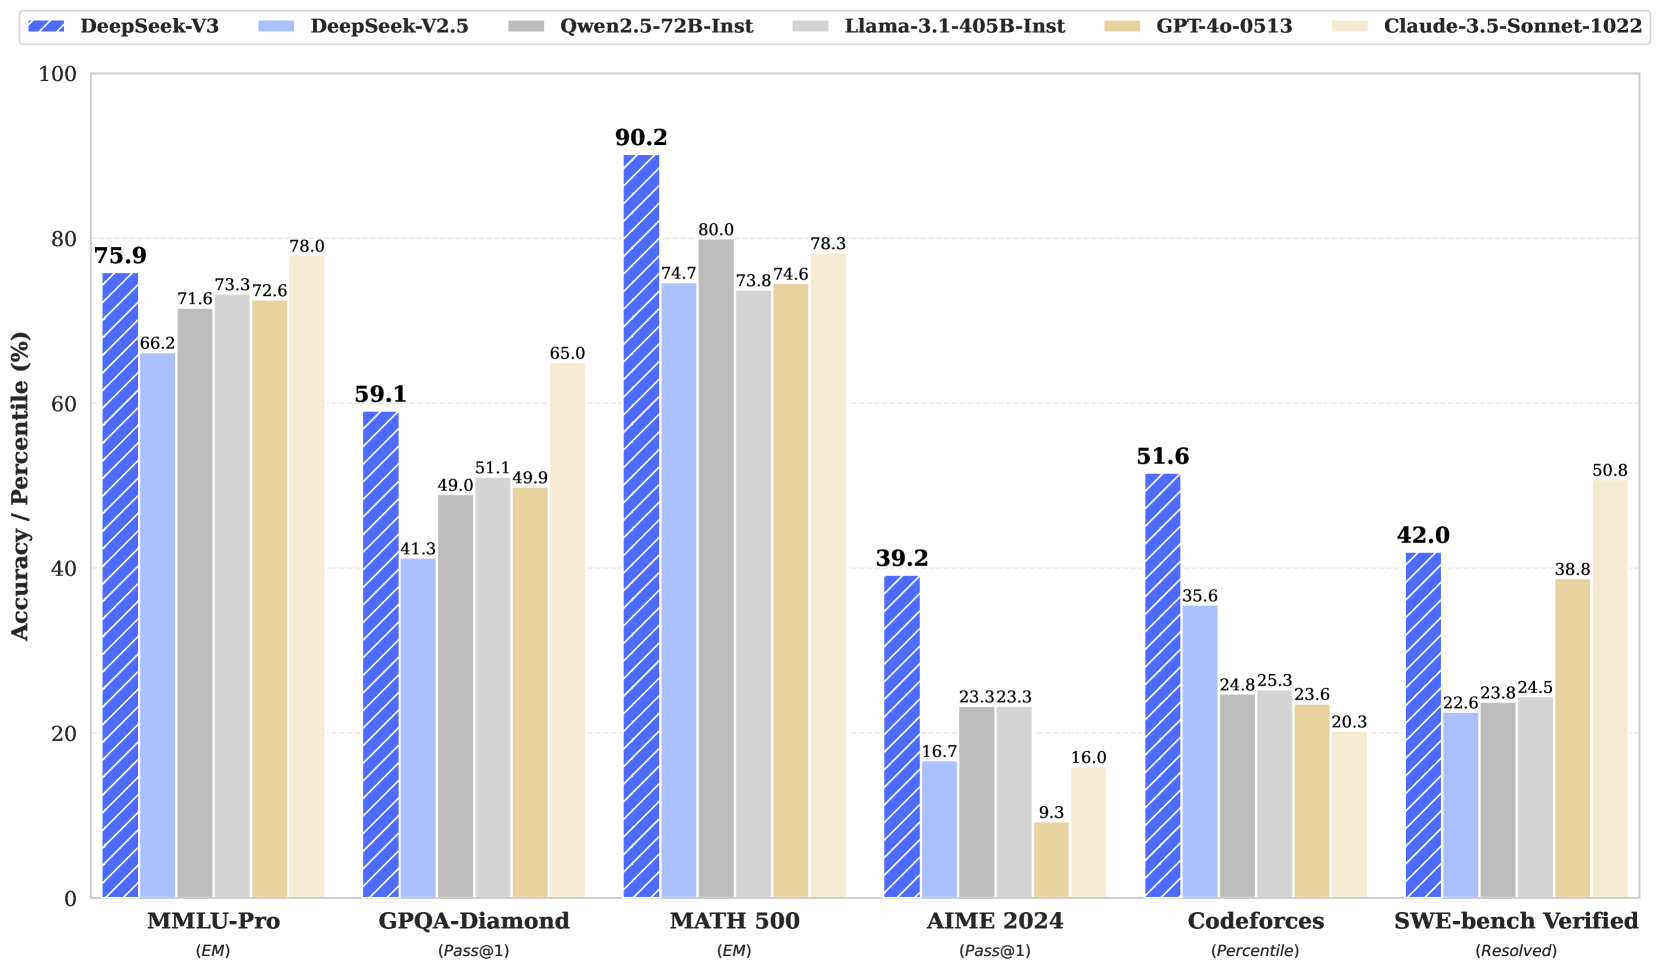
| **MMLU-Pro** *(EM)* | **75.9** | 66.2 | 71.6 | 73.3 | 72.6 | 78.0 |
| **GPQA-Diamond** *(Pass@1)* | **59.1** | 41.3 | 49.0 | 51.1 | 49.9 | 65.0 |
| **MATH 500** *(EM)* | **90.2** | 74.7 | 80.0 | 73.8 | 74.6 | 78.3 |
| **AIME 2024** *(Pass@1)* | **39.2** | 16.7 | 23.3 | 23.3 | 9.3 | 16.0 |
| **Codeforces** *(Percentile)* | **51.6** | 35.6 | 24.8 | 25.3 | 23.6 | 20.3 |
| **SWE-bench Verified** *(Resolved)* | **42.0** | 22.6 | 23.8 | 24.5 | 38.8 | 50.8 |
---
## 4. Trend Analysis and Key Observations
### General Trends
* **DeepSeek-V3 Performance:** In every category, the DeepSeek-V3 value is highlighted in a **bold font**, indicating it is the primary subject of the chart. It outperforms its predecessor (DeepSeek-V2.5) significantly across all benchmarks.
* **Competitive Standing:** DeepSeek-V3 holds the highest score in 4 out of the 6 benchmarks shown (MMLU-Pro and SWE-bench Verified being the exceptions where Claude-3.5-Sonnet-1022 leads).
### Category Specifics
1. **MMLU-Pro (EM):** Most models cluster between 71% and 78%. Claude-3.5-Sonnet-1022 leads this category at 78.0%, followed by DeepSeek-V3 at 75.9%.
2. **GPQA-Diamond (Pass@1):** Claude-3.5-Sonnet-1022 leads (65.0%), with DeepSeek-V3 following (59.1%). There is a significant drop-off to the other models which are near or below 50%.
3. **MATH 500 (EM):** DeepSeek-V3 shows a dominant lead at 90.2%, which is 10.2 percentage points higher than the next closest model (Qwen2.5-72B-Inst at 80.0%).
4. **AIME 2024 (Pass@1):** DeepSeek-V3 shows a very strong lead at 39.2%, more than double the performance of most other models in the set (e.g., DeepSeek-V2.5 at 16.7% and Claude at 16.0%).
5. **Codeforces (Percentile):** DeepSeek-V3 leads significantly at 51.6%. Interestingly, the "frontier" Western models (GPT-4o and Claude-3.5) perform the worst in this specific coding percentile metric (23.6% and 20.3% respectively).
6. **SWE-bench Verified (Resolved):** Claude-3.5-Sonnet-1022 leads at 50.8%. DeepSeek-V3 follows at 42.0%, showing a substantial improvement over DeepSeek-V2.5 (22.6%).
---
## 5. Axis and Scale Details
* **Y-Axis:** Ranges from 0 to 100 with major increments every 20 units (0, 20, 40, 60, 80, 100). Horizontal dashed grid lines are present at each 20-unit interval to facilitate visual alignment.
* **X-Axis:** Categorical, representing six distinct benchmarks. Each category contains a cluster of six bars corresponding to the models in the legend.