## Heatmap: Expected Attention
### Overview
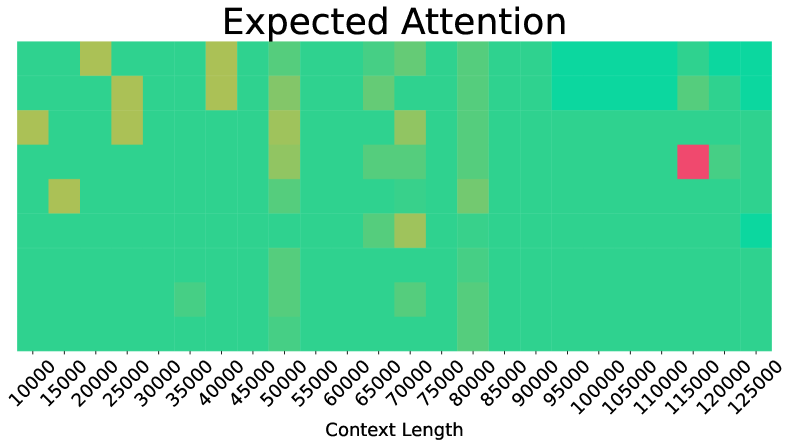
The image is a heatmap titled "Expected Attention," visualizing the relationship between **Context Length** (x-axis) and **Model Size** (y-axis). The color gradient ranges from green (low attention) to yellow (medium) to red (high), indicating varying levels of attention across different combinations of context length and model size. A prominent red square at (115,000, 115,000) stands out as the highest attention value, while scattered yellow squares appear in lower-left and mid-range regions.
---
### Components/Axes
- **Title**: "Expected Attention" (centered at the top).
- **X-axis (Context Length)**: Labeled "Context Length" with values from 10,000 to 125,000 in increments of 15,000.
- **Y-axis (Model Size)**: Labeled "Model Size" with values from 10,000 to 125,000 in increments of 15,000.
- **Color Legend**:
- **Green**: Low attention (dominant in lower-left and mid-range regions).
- **Yellow**: Medium attention (scattered in lower-left and mid-range regions).
- **Red**: High attention (single red square at (115,000, 115,000)).
---
### Detailed Analysis
- **Red Square**: Located at (115,000, 115,000), this is the only red data point, indicating the highest expected attention. Its position suggests a critical threshold or optimal performance at this specific combination of context length and model size.
- **Yellow Squares**:
- Clustered in the lower-left region (e.g., 15,000–45,000 context length and 15,000–65,000 model size).
- Scattered in mid-range regions (e.g., 55,000–85,000 context length and 55,000–85,000 model size).
- **Green Regions**: Dominant in the upper-right and lower-right corners, indicating minimal attention for larger context lengths and model sizes beyond the red/yellow zones.
---
### Key Observations
1. **Peak Attention**: The red square at (115,000, 115,000) is the only high-attention value, suggesting a unique or critical interaction at this point.
2. **Medium Attention Zones**: Yellow squares are concentrated in lower context lengths and mid-range model sizes, implying moderate attention in these ranges.
3. **Low Attention Dominance**: Green regions dominate the upper-right and lower-right, indicating reduced attention for larger context lengths or model sizes.
---
### Interpretation
The heatmap reveals that **attention is most concentrated at the intersection of 115,000 context length and 115,000 model size**, possibly indicating an optimal or critical configuration for the model. The scattered yellow squares suggest variability in attention across lower and mid-range values, while the dominance of green in larger context/model sizes implies diminishing returns or reduced focus in those regions. This could reflect a trade-off between computational resources (model size) and input complexity (context length), with the red square representing a "sweet spot" for efficiency or performance. The absence of other red squares highlights the uniqueness of this peak, warranting further investigation into why this specific combination maximizes attention.