## Bar Chart: Distribution of Gallery Sizes (Similarity Threshold = 0.8)
### Overview
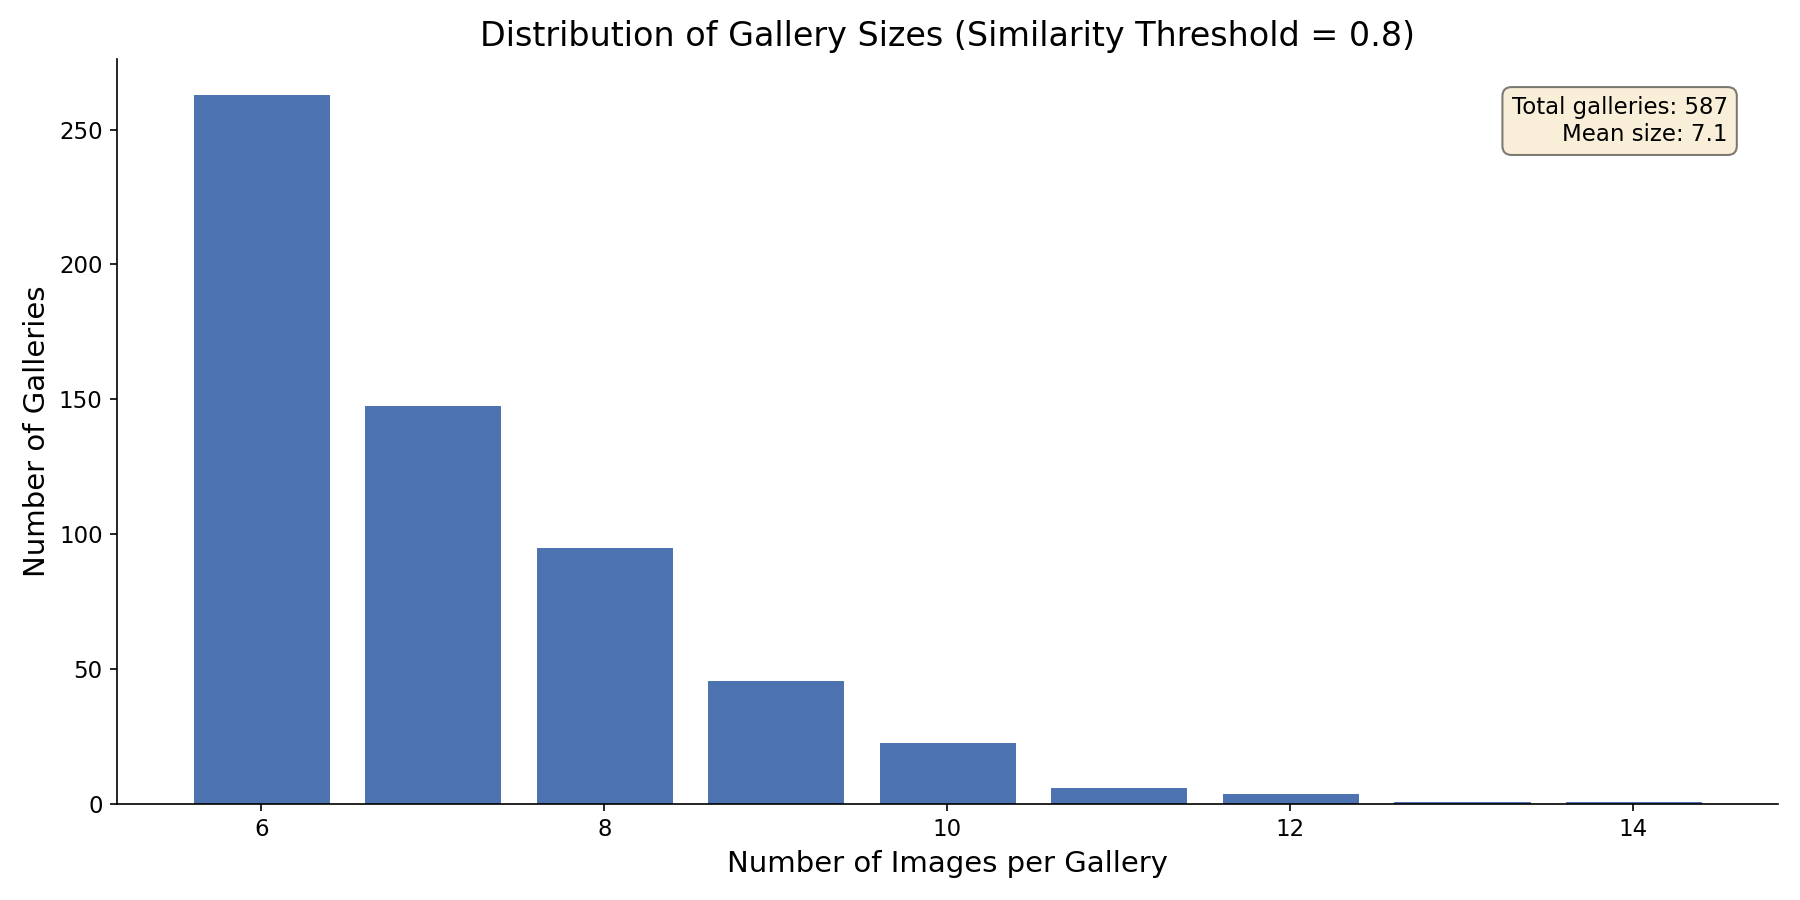
The chart visualizes the distribution of gallery sizes based on a similarity threshold of 0.8. It shows the number of galleries grouped by the number of images they contain, with a total of 587 galleries and a mean gallery size of 7.1 images.
### Components/Axes
- **X-Axis**: "Number of Images per Gallery" (categories: 6, 8, 10, 12, 14)
- **Y-Axis**: "Number of Galleries" (scale: 0 to 250, increments of 50)
- **Legend**: Located in the top-right corner, labeled with "Total galleries: 587" and "Mean size: 7.1". The bar color is blue (#4682b4).
- **Title**: Positioned at the top-center of the chart.
### Detailed Analysis
- **Number of Images per Gallery (6)**: Approximately 260 galleries (tallest bar).
- **Number of Images per Gallery (8)**: Approximately 150 galleries.
- **Number of Images per Gallery (10)**: Approximately 90 galleries.
- **Number of Images per Gallery (12)**: Approximately 40 galleries.
- **Number of Images per Gallery (14)**: Approximately 5 galleries (shortest bar).
### Key Observations
1. The distribution is heavily skewed toward smaller gallery sizes, with the majority of galleries containing 6–8 images.
2. Galleries with 10 or more images represent a long tail, decreasing sharply in frequency.
3. The mean gallery size (7.1) is slightly higher than the mode (6), indicating a few larger galleries influence the average.
### Interpretation
The data suggests that most galleries are small, with a concentration around 6–8 images. The similarity threshold of 0.8 likely groups galleries with visually similar content, resulting in fewer galleries with larger image counts. The mean size exceeding the mode implies that while most galleries are small, a subset of larger galleries (e.g., 10–14 images) exists but is rare. This distribution could reflect curation practices, content diversity, or algorithmic clustering effects under the specified similarity threshold.