## Violin Plot: F1 Score Comparison Across Models and Phases
### Overview
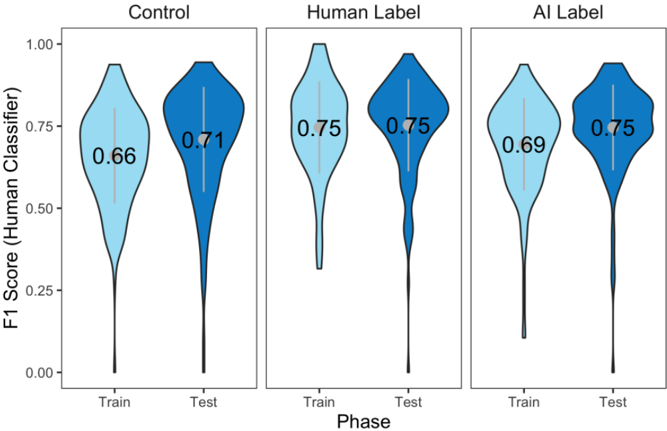
The image presents three side-by-side violin plots comparing the distribution of F1 scores for three models: **Control**, **Human Label**, and **AI Label**. Each model is evaluated across two phases: **Train** and **Test**. The y-axis represents the F1 score (ranging from 0.00 to 1.00), while the x-axis denotes the phase (Train/Test). Mean values are annotated within each violin plot.
---
### Components/Axes
- **Y-Axis**: "F1 Score (Human Classifier)" (scale: 0.00–1.00).
- **X-Axis**: "Phase" (categories: Train, Test).
- **Legend**: No explicit legend, but colors are used to differentiate phases:
- **Light blue**: Train phase.
- **Dark blue**: Test phase.
- **Sections**:
- **Control**: Leftmost plot.
- **Human Label**: Middle plot.
- **AI Label**: Rightmost plot.
---
### Detailed Analysis
#### Control Model
- **Train**: F1 score distribution peaks around 0.66 (mean = 0.66). The violin is moderately wide, indicating moderate variability.
- **Test**: F1 score distribution peaks around 0.71 (mean = 0.71). Slightly narrower than Train, suggesting reduced variability.
#### Human Label Model
- **Train**: F1 score distribution peaks sharply at 0.75 (mean = 0.75). Narrow violin indicates low variability.
- **Test**: Identical to Train (mean = 0.75). Consistent performance across phases.
#### AI Label Model
- **Train**: F1 score distribution peaks around 0.69 (mean = 0.69). Wider than Human Label but narrower than Control.
- **Test**: F1 score distribution peaks at 0.75 (mean = 0.75), matching Human Label. Narrow violin suggests high consistency.
---
### Key Observations
1. **Human Label** achieves the highest and most consistent F1 scores (0.75) in both phases.
2. **AI Label** matches Human Label in Test performance (0.75) but underperforms in Train (0.69).
3. **Control** has the lowest scores (0.66 Train, 0.71 Test), with moderate variability.
4. **Test-phase improvement** is observed for Control (+0.05) and AI Label (+0.06), but Human Label shows no change.
5. **AI Label's Test performance** equals Human Label despite lower Train scores, suggesting potential overfitting or domain-specific strengths.
---
### Interpretation
The data highlights that **Human Label** consistently outperforms both Control and AI Label, emphasizing the value of human expertise in classification tasks. The **AI Label** model demonstrates parity with Human Label in Test scenarios, raising questions about its training dynamics (e.g., overfitting to test-like data). The **Control** model serves as a baseline, showing limited effectiveness. Notably, the AI Label’s Test performance matching Human Label despite inferior Train scores suggests either:
- **Domain-specific optimization** (e.g., test data aligns with AI strengths),
- **Data leakage** during training,
- Or **task-specific advantages** of the AI approach.
These findings underscore the need for rigorous evaluation protocols to distinguish between genuine model capability and artifacts of evaluation design.