## Diagram: Jerry's Softball Schedule Calculation
### Overview
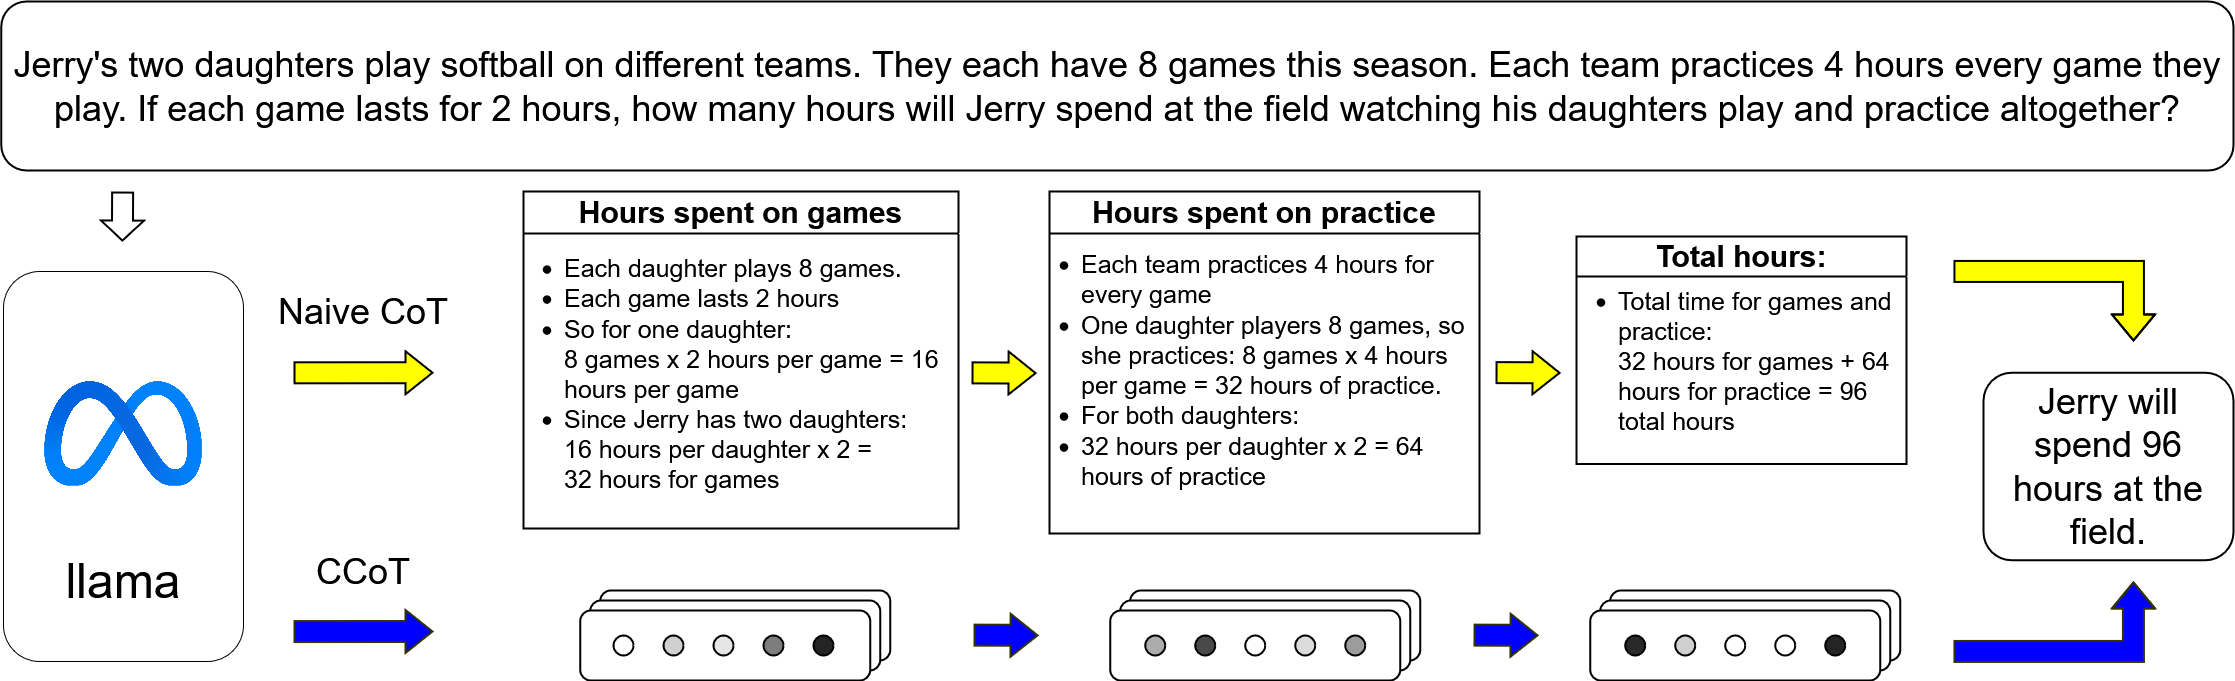
The image presents a diagram illustrating the calculation of the total hours Jerry spends watching his daughters play softball, considering both game time and practice time. It uses a chain-of-thought approach, breaking down the calculation into steps.
### Components/Axes
* **Text Box 1 (Top):** Problem statement: "Jerry's two daughters play softball on different teams. They each have 8 games this season. Each team practices 4 hours every game they play. If each game lasts for 2 hours, how many hours will Jerry spend at the field watching his daughters play and practice altogether?"
* **Left Side:**
* "Llama" inside a rounded rectangle with an infinity symbol above it.
* "Naive CoT" label with a yellow arrow pointing to the right.
* "CCoT" label with a blue arrow pointing to the right.
* **Middle Section:** Three boxes, each representing a step in the calculation:
* **Hours spent on games:** Lists the calculation for total game hours.
* **Hours spent on practice:** Lists the calculation for total practice hours.
* **Total hours:** Sums the game and practice hours.
* **Right Side:**
* "Jerry will spend 96 hours at the field." inside a rounded rectangle.
* **Arrows:** Yellow and blue arrows connecting the components, indicating the flow of the calculation.
* **Visual Representation:** Series of stacked rectangles with circles inside, representing the progression of the calculation. The circles are filled in to varying degrees, visually indicating the accumulation of time.
### Detailed Analysis or ### Content Details
**1. Problem Statement:**
* Jerry has two daughters playing softball.
* Each daughter plays 8 games.
* Each team practices 4 hours every game.
* Each game lasts 2 hours.
* The question is: How many hours will Jerry spend at the field?
**2. Hours spent on games:**
* Each daughter plays 8 games.
* Each game lasts 2 hours.
* For one daughter: 8 games * 2 hours/game = 16 hours per game.
* Since Jerry has two daughters: 16 hours/daughter * 2 = 32 hours for games.
**3. Hours spent on practice:**
* Each team practices 4 hours for every game.
* One daughter plays 8 games, so she practices: 8 games * 4 hours/game = 32 hours of practice.
* For both daughters: 32 hours/daughter * 2 = 64 hours of practice.
**4. Total hours:**
* Total time for games and practice: 32 hours for games + 64 hours for practice = 96 total hours.
**5. Visual Representation:**
* The stacked rectangles with circles visually represent the calculation steps.
* The circles are filled in to varying degrees, indicating the accumulation of time.
* The first set of rectangles has circles that are mostly empty.
* The second set of rectangles has circles that are partially filled.
* The third set of rectangles has circles that are mostly filled.
### Key Observations
* The diagram clearly outlines the steps to calculate the total hours Jerry spends at the field.
* The visual representation provides a supplementary understanding of the calculation.
* The use of "Naive CoT" and "CCoT" suggests a comparison of different approaches to problem-solving, although the diagram primarily focuses on the calculation itself.
### Interpretation
The diagram effectively illustrates the calculation of Jerry's total time commitment to watching his daughters' softball activities. It breaks down the problem into manageable steps, making it easy to follow the logic. The visual representation enhances understanding by providing a visual cue for the accumulation of time. The diagram demonstrates that Jerry will spend a total of 96 hours at the field. The "Naive CoT" and "CCoT" labels suggest that this calculation might be part of a larger comparison of different problem-solving methods, but the diagram itself focuses on the arithmetic.