\n
## Diagram: Softball Practice Time Calculation
### Overview
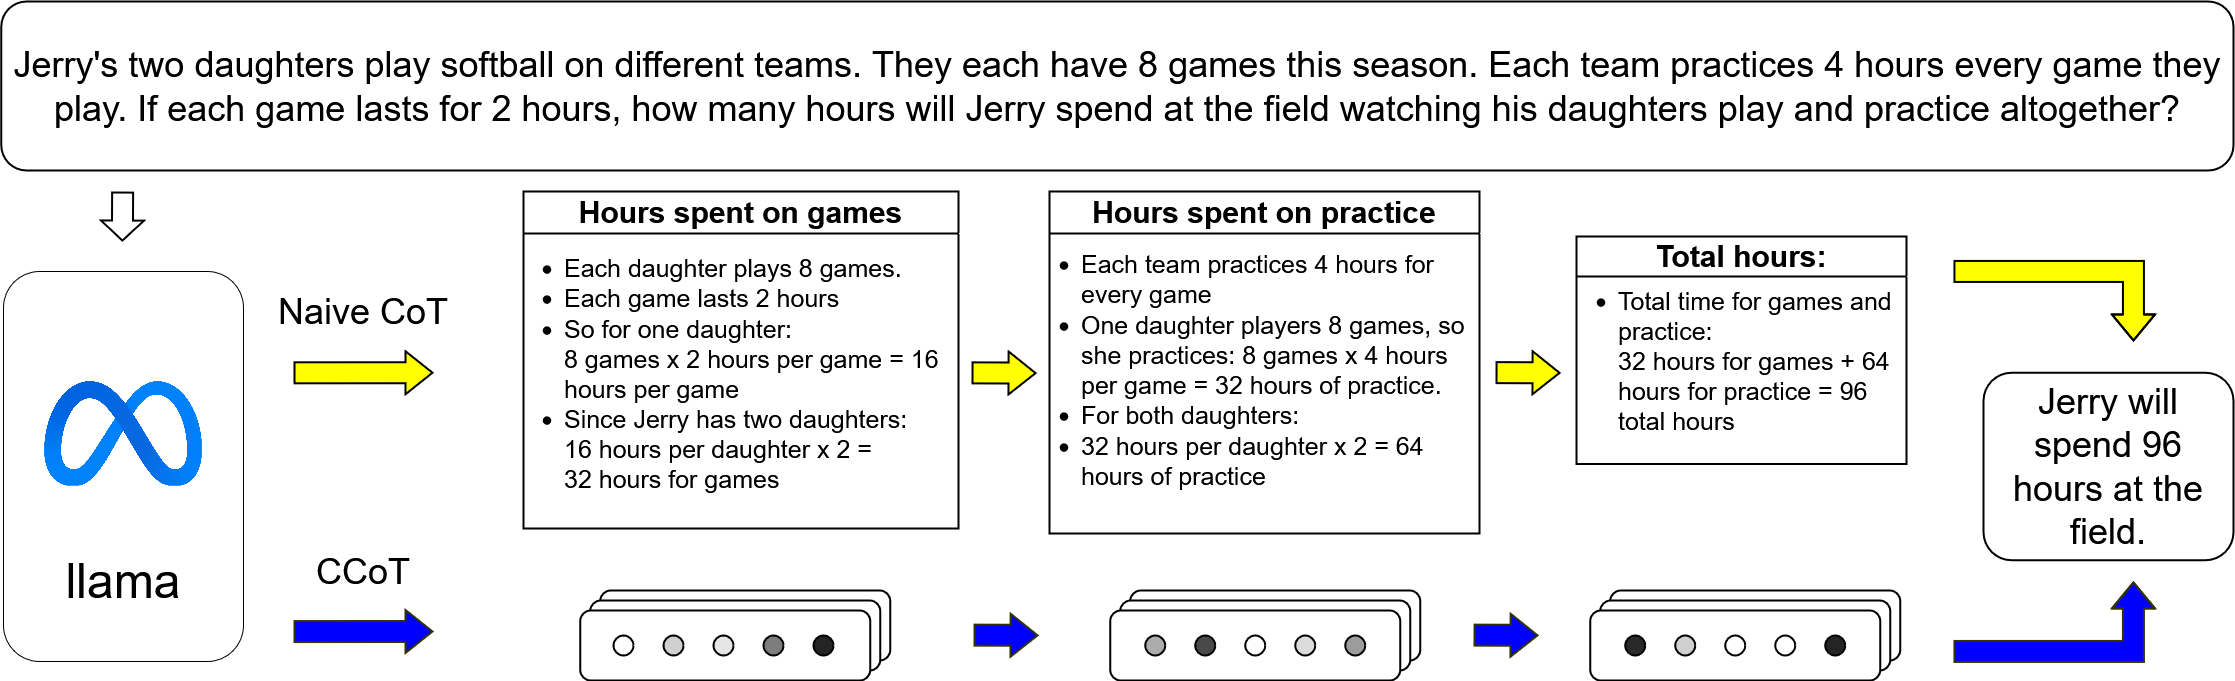
This diagram visually breaks down the calculation of the total time Jerry spends watching his two daughters play and practice softball. It presents the problem statement, then divides the calculation into "Hours spent on games" and "Hours spent on practice" sections, culminating in the "Total hours" calculation. The diagram uses a flow-chart style with arrows to indicate the progression of the calculation. It also includes two logos, "Naive CoT" and "llama", with connecting arrows.
### Components/Axes
The diagram is divided into three main sections:
1. **Problem Statement:** Located at the top, it states the scenario.
2. **Calculation Sections:** Three columns labeled "Hours spent on games", "Hours spent on practice", and "Total hours". Each column contains bullet points detailing the steps in the calculation.
3. **Result:** A box on the right stating the final answer.
4. **Logos & Arrows:** "Naive CoT" (left) and "llama" (bottom-left) logos connected by arrows.
### Detailed Analysis or Content Details
**Problem Statement:**
"Jerry's two daughters play softball on different teams. They each have 8 games this season. Each team practices 4 hours every game they play. If each game lasts 2 hours, how many hours will Jerry spend at the field watching his daughters play and practice altogether?"
**Hours spent on games:**
* "Each daughter plays 8 games."
* "Each game lasts 2 hours."
* "So for one daughter: 8 games x 2 hours per game = 16 hours per game"
* "Since Jerry has two daughters: 16 hours per daughter x 2 = 32 hours for games"
**Hours spent on practice:**
* "Each team practices 4 hours for every game"
* "One daughter players 8 games, so she practices: 8 games x 4 hours per game = 32 hours of practice."
* "For both daughters: 32 hours per daughter x 2 = 64 hours of practice"
**Total hours:**
* "Total time for games and practice: 32 hours for games + 64 hours for practice = 96 total hours"
**Result:**
"Jerry will spend 96 hours at the field."
**Logos & Arrows:**
* "Naive CoT" logo is a blue infinity symbol. An arrow points from this logo to the calculation section.
* "llama" logo is green. An arrow points from this logo to the calculation section.
### Key Observations
The diagram clearly outlines a step-by-step calculation. The use of bullet points and clear labeling makes the process easy to follow. The diagram emphasizes the multiplication and addition operations required to arrive at the final answer. The inclusion of the logos "Naive CoT" and "llama" suggests this diagram might be related to a comparison of different reasoning approaches (Chain of Thought).
### Interpretation
The diagram demonstrates a simple arithmetic problem solved through a breakdown into smaller, manageable steps. The structure suggests a pedagogical approach, aiming to illustrate the logic behind the calculation. The "Naive CoT" and "llama" logos hint at a comparison of different methods for solving the problem, potentially related to Large Language Model reasoning techniques. The diagram's flow visually represents the chain of thought required to reach the solution. The diagram is not presenting data in the traditional sense, but rather a logical process. It's a visual representation of a problem-solving strategy.