# Technical Document Extraction
## Line Graphs (Left Section)
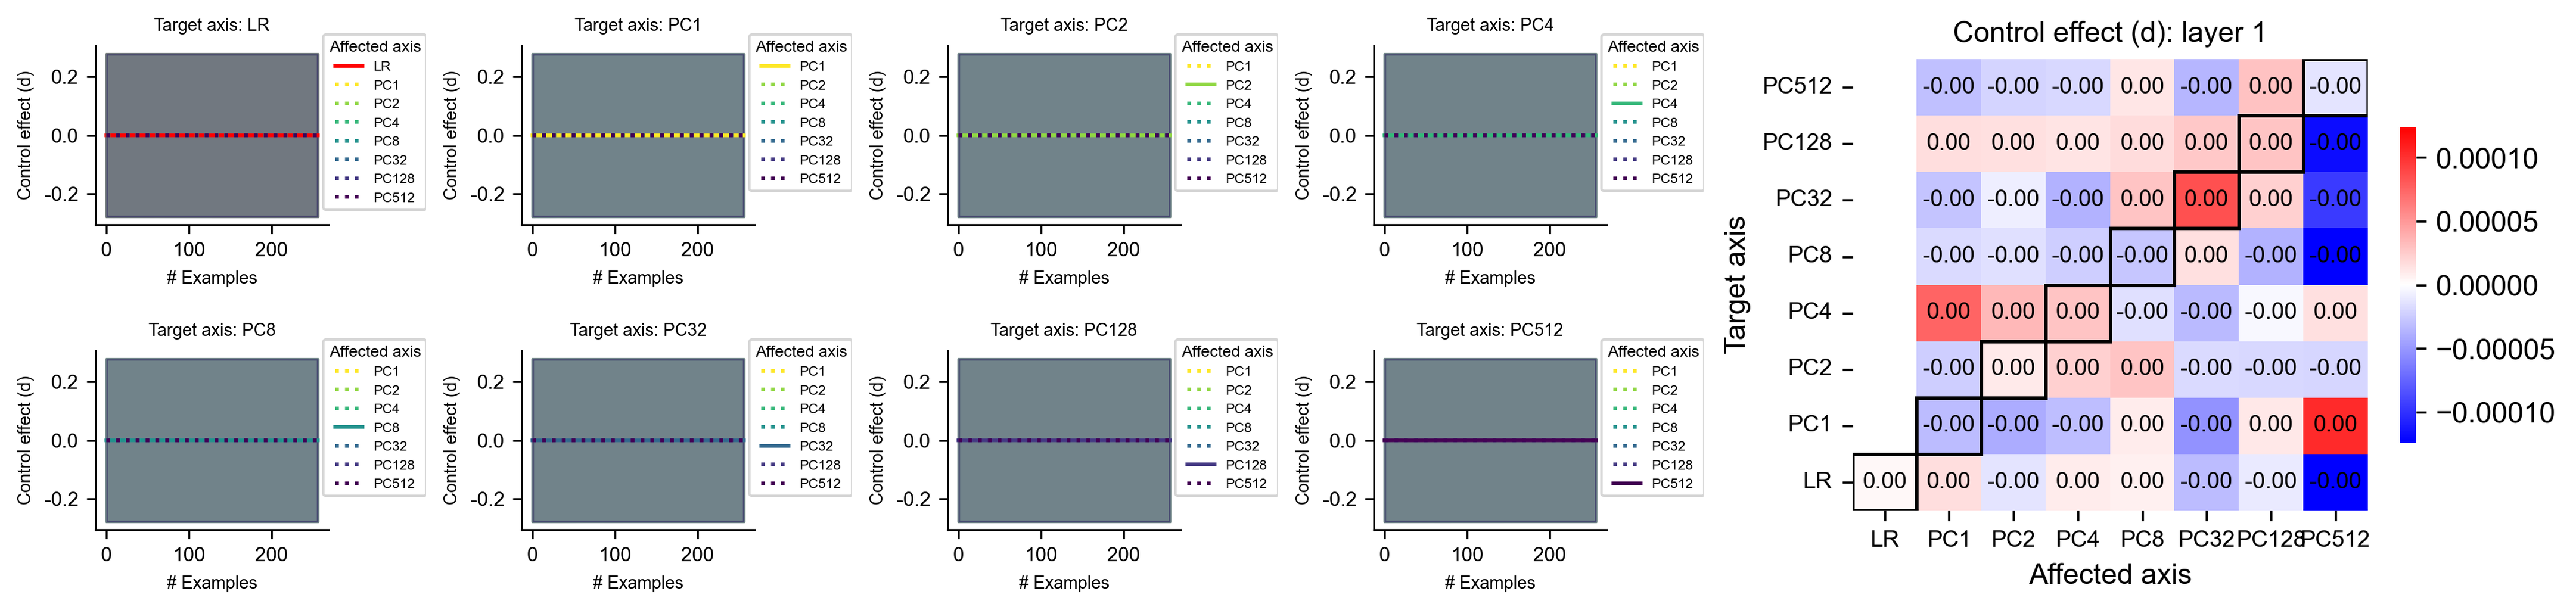
Eight line graphs depict control effects across different target axes. Each graph has:
- **X-axis**: `# Examples` (0–200)
- **Y-axis**: `Control effect (d)` (-0.2 to 0.2)
- **Legend**:
- `LR` (red solid line)
- `PC1` (yellow solid)
- `PC2` (green solid)
- `PC4` (cyan solid)
- `PC8` (blue solid)
- `PC32` (purple solid)
- `PC128` (dark purple solid)
- `PC512` (black solid)
### Graph Details:
1. **Target Axis: LR**
- Affected axes: `LR` (red solid line at y=0.00)
- All other axes show no deviation (flat lines at y=0.00).
2. **Target Axis: PC1**
- Affected axes: `PC1` (yellow solid line at y=0.00)
- All other axes show no deviation.
3. **Target Axis: PC2**
- Affected axes: `PC2` (green solid line at y=0.00)
- All other axes show no deviation.
4. **Target Axis: PC4**
- Affected axes: `PC4` (cyan solid line at y=0.00)
- All other axes show no deviation.
5. **Target Axis: PC8**
- Affected axes: `PC8` (blue solid line at y=0.00)
- All other axes show no deviation.
6. **Target Axis: PC32**
- Affected axes: `PC32` (purple solid line at y=0.00)
- All other axes show no deviation.
7. **Target Axis: PC128**
- Affected axes: `PC128` (dark purple solid line at y=0.00)
- All other axes show no deviation.
8. **Target Axis: PC512**
- Affected axes: `PC512` (black solid line at y=0.00)
- All other axes show no deviation.
## Heatmap (Right Section)
A heatmap labeled `Control effect (d): layer 1` with:
- **Rows**: Target axes (`LR`, `PC1`, `PC2`, `PC4`, `PC8`, `PC32`, `PC128`, `PC512`)
- **Columns**: Affected axes (`PC1`, `PC2`, `PC4`, `PC8`, `PC32`, `PC128`, `PC512`, `LR`)
- **Color Scale**:
- Red: Positive control effect (up to 0.00010)
- Blue: Negative control effect (down to -0.00010)
- White: Neutral (0.00000)
### Heatmap Values:
| Target Axis | PC1 | PC2 | PC4 | PC8 | PC32 | PC128 | PC512 | LR |
|-------------|-------|-------|-------|-------|-------|-------|-------|-------|
| **LR** | 0.00 | -0.00 | -0.00 | 0.00 | -0.00 | 0.00 | -0.00 | 0.00 |
| **PC1** | 0.00 | 0.00 | -0.00 | 0.00 | 0.00 | 0.00 | -0.00 | 0.00 |
| **PC2** | 0.00 | 0.00 | 0.00 | 0.00 | 0.00 | 0.00 | -0.00 | 0.00 |
| **PC4** | 0.00 | 0.00 | 0.00 | -0.00 | 0.00 | -0.00 | -0.00 | 0.00 |
| **PC8** | 0.00 | 0.00 | 0.00 | 0.00 | -0.00 | -0.00 | -0.00 | 0.00 |
| **PC32** | 0.00 | 0.00 | 0.00 | 0.00 | 0.00 | -0.00 | -0.00 | 0.00 |
| **PC128** | 0.00 | 0.00 | 0.00 | 0.00 | 0.00 | 0.00 | -0.00 | 0.00 |
| **PC512** | 0.00 | 0.00 | 0.00 | 0.00 | 0.00 | 0.00 | 0.00 | 0.00 |
### Key Observations:
- **Diagonal Dominance**: All diagonal cells (target = affected axis) show `0.00`, indicating no self-control effect.
- **Non-Diagonal Cells**: Most cells show `-0.00` or `0.00`, suggesting minimal cross-axis control effects.
- **Color Coding**: Red and blue cells are absent, implying no significant positive/negative control effects between axes.