## CDF Plot: E2E Latency Comparison
### Overview
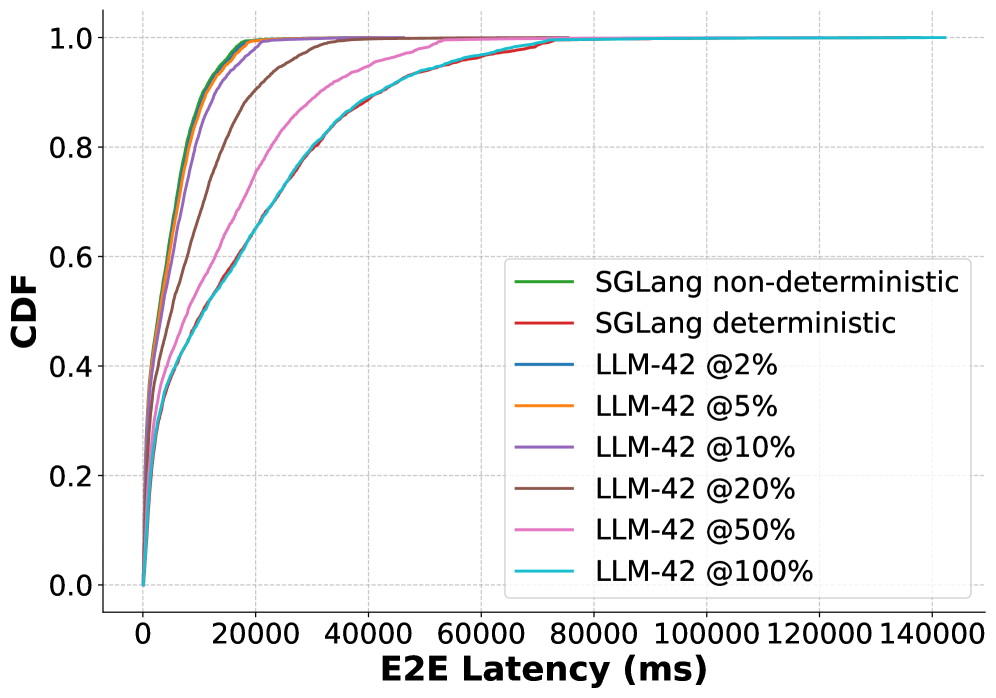
The image is a cumulative distribution function (CDF) plot comparing the end-to-end (E2E) latency of SGLang (both non-deterministic and deterministic versions) and LLM-42 models at various percentages (2%, 5%, 10%, 20%, 50%, and 100%). The x-axis represents E2E latency in milliseconds (ms), and the y-axis represents the cumulative distribution function (CDF), ranging from 0 to 1.
### Components/Axes
* **X-axis:** E2E Latency (ms). Scale ranges from 0 to 140000 ms, with tick marks at intervals of 20000 ms.
* **Y-axis:** CDF. Scale ranges from 0.0 to 1.0, with tick marks at intervals of 0.2.
* **Legend:** Located on the right side of the plot, identifying each line by color and label:
* Green: SGLang non-deterministic
* Red: SGLang deterministic
* Blue: LLM-42 @2%
* Orange: LLM-42 @5%
* Purple: LLM-42 @10%
* Brown: LLM-42 @20%
* Pink: LLM-42 @50%
* Cyan: LLM-42 @100%
### Detailed Analysis
* **SGLang non-deterministic (Green):** The green line rises sharply near 0 ms and reaches CDF = 1.0 around 10000 ms.
* **SGLang deterministic (Red):** The red line rises sharply near 0 ms and reaches CDF = 1.0 around 10000 ms.
* **LLM-42 @2% (Blue):** The blue line rises sharply near 0 ms and reaches CDF = 1.0 around 20000 ms.
* **LLM-42 @5% (Orange):** The orange line rises sharply near 0 ms and reaches CDF = 1.0 around 25000 ms.
* **LLM-42 @10% (Purple):** The purple line rises sharply near 0 ms and reaches CDF = 1.0 around 30000 ms.
* **LLM-42 @20% (Brown):** The brown line rises sharply near 0 ms and reaches CDF = 1.0 around 40000 ms.
* **LLM-42 @50% (Pink):** The pink line rises sharply near 0 ms and reaches CDF = 1.0 around 60000 ms.
* **LLM-42 @100% (Cyan):** The cyan line rises sharply near 0 ms and reaches CDF = 1.0 around 80000 ms.
### Key Observations
* SGLang (both deterministic and non-deterministic) exhibits the lowest E2E latency, with the CDF reaching 1.0 at approximately 10000 ms.
* As the percentage associated with LLM-42 increases, the E2E latency also increases. LLM-42 @2% has the lowest latency among the LLM-42 variants, while LLM-42 @100% has the highest.
* The CDF curves for all models are generally steep, indicating that most requests have relatively low latency.
### Interpretation
The CDF plot illustrates the distribution of E2E latency for different models. SGLang demonstrates significantly lower latency compared to LLM-42 at various percentages. The increasing latency of LLM-42 as the percentage increases suggests a potential correlation between the percentage parameter and the processing time or resource allocation within the LLM-42 model. The steepness of the CDF curves indicates that the latency is relatively consistent for each model, with most requests completing within a specific time range.