## Line Chart: Cumulative Distribution Function (CDF) of E2E Latency
### Overview
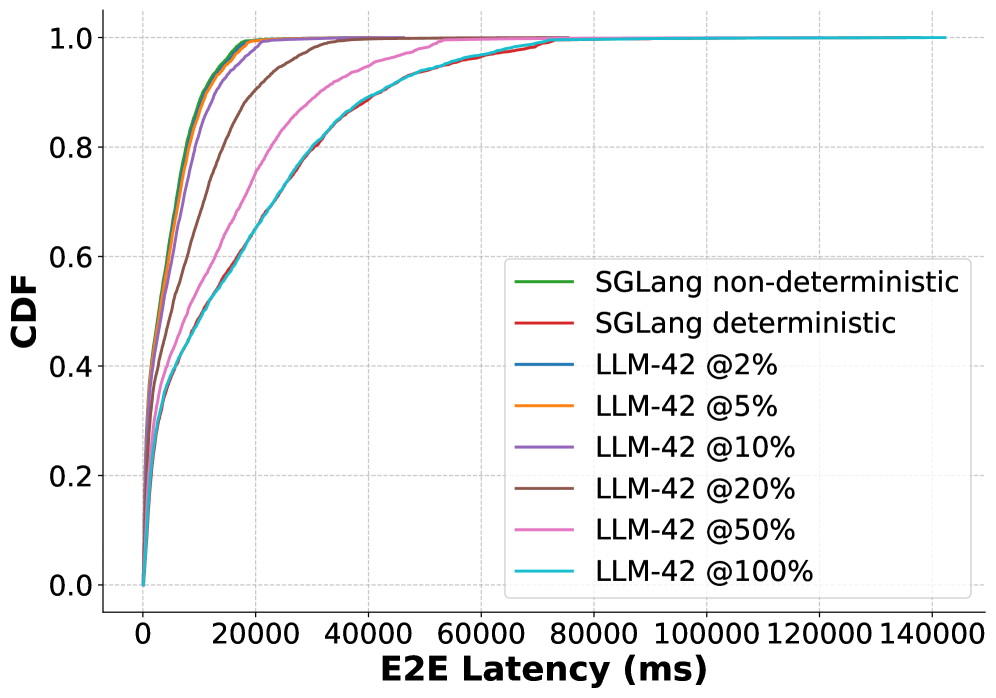
This image displays a Cumulative Distribution Function (CDF) plot comparing the End-to-End (E2E) latency of various LLM (Large Language Model) configurations. The chart illustrates how different configurations affect the distribution of latency, with the X-axis representing latency in milliseconds (ms) and the Y-axis representing the cumulative probability (0.0 to 1.0).
### Components/Axes
* **X-Axis:** Labeled "E2E Latency (ms)". The scale ranges from 0 to 140,000, with major grid lines every 20,000 units.
* **Y-Axis:** Labeled "CDF". The scale ranges from 0.0 to 1.0, with major grid lines every 0.2 units.
* **Legend:** Positioned in the center-right of the chart area. It contains eight distinct data series, color-coded as follows:
* **Green:** SGLang non-deterministic
* **Red:** SGLang deterministic
* **Blue:** LLM-42 @2%
* **Orange:** LLM-42 @5%
* **Purple:** LLM-42 @10%
* **Brown:** LLM-42 @20%
* **Pink:** LLM-42 @50%
* **Cyan:** LLM-42 @100%
### Detailed Analysis
The chart displays eight curves, all originating at (0,0) and rising monotonically to a CDF of 1.0. The curves shift progressively to the right as the "LLM-42 @" percentage increases, indicating higher latency.
**Trend Verification & Data Points:**
1. **High-Performance Cluster (Leftmost):**
* **SGLang non-deterministic (Green)** and **SGLang deterministic (Red)**: These lines are nearly identical and represent the lowest latency. They reach a CDF of 1.0 at approximately 20,000ms.
* **LLM-42 @2% (Blue)** and **LLM-42 @5% (Orange)**: These lines closely track the SGLang lines, also reaching a CDF of 1.0 at approximately 20,000ms to 25,000ms.
2. **Mid-Range Performance:**
* **LLM-42 @10% (Purple)**: The curve shifts rightward, reaching a CDF of 1.0 at approximately 40,000ms.
* **LLM-42 @20% (Brown)**: The curve shifts further right, reaching a CDF of 1.0 at approximately 50,000ms.
3. **Low-Performance Cluster (Rightmost):**
* **LLM-42 @50% (Pink)**: This curve shows a significant latency increase, reaching a CDF of 1.0 at approximately 75,000ms.
* **LLM-42 @100% (Cyan)**: This is the rightmost curve, indicating the highest latency. It reaches a CDF of 1.0 at approximately 140,000ms.
### Key Observations
* **Performance Correlation:** There is a direct, positive correlation between the percentage value assigned to "LLM-42" and the E2E latency. As the percentage increases, the latency distribution shifts significantly to the right.
* **SGLang Efficiency:** The SGLang configurations (both deterministic and non-deterministic) perform at a level comparable to the most efficient LLM-42 configurations (2% and 5%).
* **Tail Latency:** The "tail" of the distribution (the latency experienced by the slowest requests) increases dramatically as the LLM-42 percentage increases. For example, the 100% configuration has a tail latency roughly 7 times higher than the 2% configuration.
### Interpretation
The data suggests that "LLM-42 @X%" likely refers to a parameter related to computational load, model size, or sampling depth (e.g., percentage of tokens processed, model sparsity, or beam width).
The significant rightward shift of the curves as the percentage increases demonstrates that the computational cost of the "LLM-42" model scales non-linearly or at least very aggressively with the percentage parameter. The fact that the SGLang configurations are clustered with the lowest LLM-42 percentages suggests that SGLang is highly optimized for low-latency inference, potentially outperforming or matching the "LLM-42" model at its most efficient settings. The "LLM-42 @100%" configuration represents a substantial performance bottleneck compared to all other tested configurations.