\n
## Chart: Cumulative Distribution Function of E2E Latency
### Overview
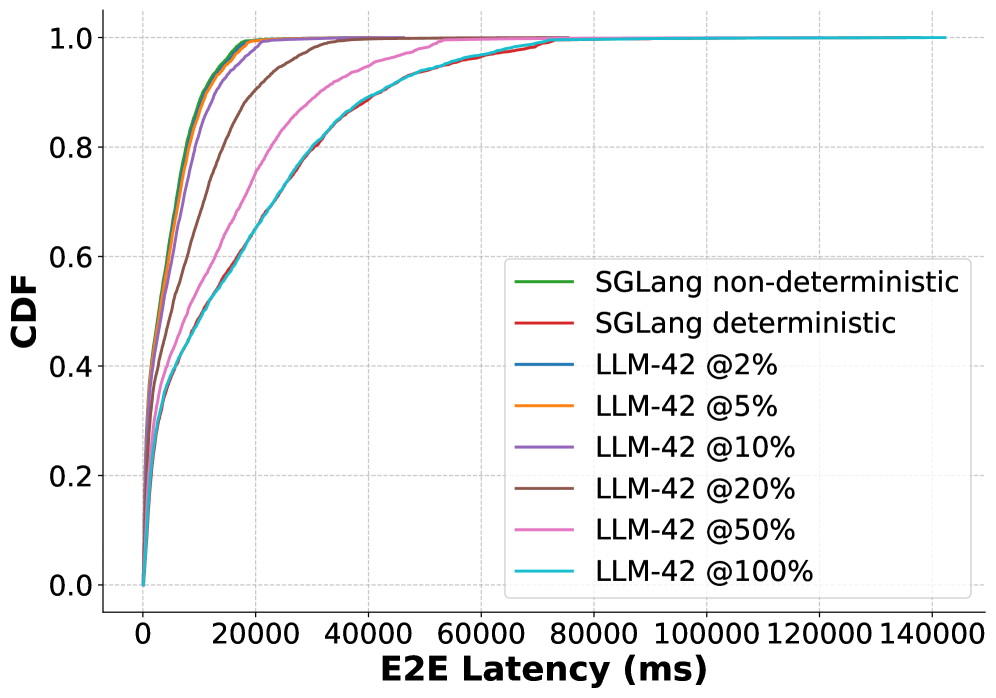
The image presents a cumulative distribution function (CDF) plot illustrating the end-to-end (E2E) latency of different language models. The x-axis represents latency in milliseconds (ms), and the y-axis represents the cumulative distribution function (CDF), ranging from 0.0 to 1.0. The chart compares the performance of "SGLang" (both non-deterministic and deterministic) and "LLM-42" at varying percentage levels (2%, 5%, 10%, 20%, 50%, and 100%).
### Components/Axes
* **X-axis Title:** "E2E Latency (ms)" - Scale ranges from 0 to 140000 ms.
* **Y-axis Title:** "CDF" - Scale ranges from 0.0 to 1.0.
* **Legend:** Located in the top-right corner of the chart.
* SGLang non-deterministic (Green)
* SGLang deterministic (Red)
* LLM-42 @2% (Dark Blue)
* LLM-42 @5% (Orange)
* LLM-42 @10% (Purple)
* LLM-42 @20% (Brown)
* LLM-42 @50% (Pink)
* LLM-42 @100% (Light Blue)
### Detailed Analysis
The chart displays several CDF curves. Here's a breakdown of each:
* **SGLang non-deterministic (Green):** This line starts at approximately CDF 0.0 at 0 ms, rises steeply to CDF 0.2 at around 5000 ms, reaches CDF 0.4 at approximately 10000 ms, CDF 0.6 at around 15000 ms, CDF 0.8 at approximately 25000 ms, and approaches CDF 1.0 around 60000 ms.
* **SGLang deterministic (Red):** This line starts at approximately CDF 0.0 at 0 ms, rises steeply to CDF 0.2 at around 2000 ms, reaches CDF 0.4 at approximately 7000 ms, CDF 0.6 at around 12000 ms, CDF 0.8 at approximately 20000 ms, and approaches CDF 1.0 around 40000 ms.
* **LLM-42 @2% (Dark Blue):** This line starts at approximately CDF 0.0 at 0 ms, rises to CDF 0.2 at around 10000 ms, reaches CDF 0.4 at approximately 20000 ms, CDF 0.6 at around 30000 ms, CDF 0.8 at approximately 50000 ms, and approaches CDF 1.0 around 90000 ms.
* **LLM-42 @5% (Orange):** This line starts at approximately CDF 0.0 at 0 ms, rises to CDF 0.2 at around 5000 ms, reaches CDF 0.4 at approximately 15000 ms, CDF 0.6 at around 25000 ms, CDF 0.8 at approximately 40000 ms, and approaches CDF 1.0 around 70000 ms.
* **LLM-42 @10% (Purple):** This line starts at approximately CDF 0.0 at 0 ms, rises to CDF 0.2 at around 3000 ms, reaches CDF 0.4 at approximately 10000 ms, CDF 0.6 at around 20000 ms, CDF 0.8 at approximately 35000 ms, and approaches CDF 1.0 around 60000 ms.
* **LLM-42 @20% (Brown):** This line starts at approximately CDF 0.0 at 0 ms, rises to CDF 0.2 at around 2000 ms, reaches CDF 0.4 at approximately 7000 ms, CDF 0.6 at around 15000 ms, CDF 0.8 at approximately 25000 ms, and approaches CDF 1.0 around 50000 ms.
* **LLM-42 @50% (Pink):** This line starts at approximately CDF 0.0 at 0 ms, rises to CDF 0.2 at around 1000 ms, reaches CDF 0.4 at approximately 5000 ms, CDF 0.6 at around 10000 ms, CDF 0.8 at approximately 18000 ms, and approaches CDF 1.0 around 40000 ms.
* **LLM-42 @100% (Light Blue):** This line starts at approximately CDF 0.0 at 0 ms, rises to CDF 0.2 at around 500 ms, reaches CDF 0.4 at approximately 3000 ms, CDF 0.6 at around 7000 ms, CDF 0.8 at approximately 12000 ms, and approaches CDF 1.0 around 30000 ms.
### Key Observations
* SGLang deterministic consistently exhibits lower latency than the non-deterministic version.
* As the percentage increases for LLM-42, the latency generally increases. LLM-42 @100% has the highest latency, while LLM-42 @2% has the highest latency.
* LLM-42 @2% has a latency profile similar to SGLang deterministic, but shifted to the right (higher latency).
* The LLM-42 curves show a clear trend: higher percentages correspond to higher latency.
### Interpretation
This chart demonstrates the trade-off between determinism and latency in language models. SGLang's deterministic mode offers lower latency but potentially at the cost of reproducibility. The LLM-42 results suggest that increasing the percentage parameter (likely related to sampling or generation strategy) increases latency. The CDF plots allow for a comparison of the distribution of latency for each model and configuration, providing insights into the reliability and performance characteristics of each. The data suggests that for applications requiring low latency, SGLang deterministic or LLM-42 @2% might be preferred, while applications prioritizing higher quality or diversity might tolerate the increased latency of LLM-42 at higher percentages. The steepness of the CDF curves indicates how quickly the models achieve a certain level of completion. A steeper curve means faster completion times for a given percentage of requests.