## Cumulative Distribution Function (CDF) Plot: End-to-End Latency Comparison
### Overview
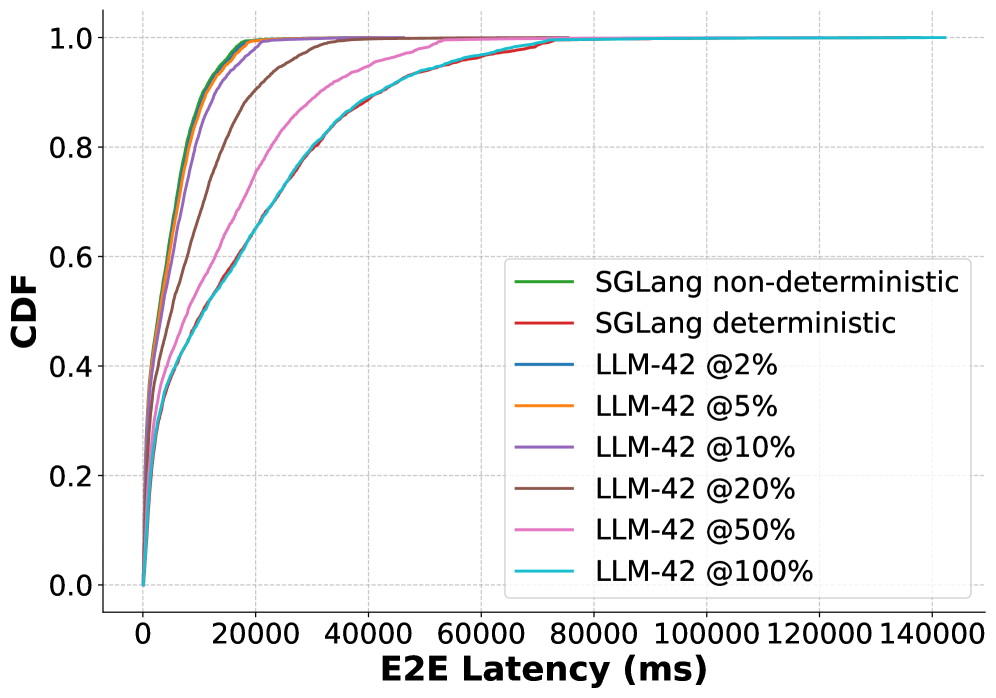
This image is a line chart displaying the Cumulative Distribution Function (CDF) of End-to-End (E2E) Latency for several systems or configurations. The chart compares the latency performance of two "SGLang" modes against multiple "LLM-42" configurations with varying percentage parameters. The plot shows how the probability (CDF) of a request completing increases as the allowed latency (in milliseconds) increases.
### Components/Axes
* **Chart Type:** Cumulative Distribution Function (CDF) line plot.
* **X-Axis:**
* **Label:** `E2E Latency (ms)`
* **Scale:** Linear scale from 0 to 140,000 milliseconds (ms).
* **Major Ticks:** 0, 20000, 40000, 60000, 80000, 100000, 120000, 140000.
* **Y-Axis:**
* **Label:** `CDF`
* **Scale:** Linear scale from 0.0 to 1.0.
* **Major Ticks:** 0.0, 0.2, 0.4, 0.6, 0.8, 1.0.
* **Legend:**
* **Position:** Center-right of the plot area.
* **Content (Top to Bottom):**
1. `SGLang non-deterministic` (Green line)
2. `SGLang deterministic` (Red line)
3. `LLM-42 @2%` (Blue line)
4. `LLM-42 @5%` (Orange line)
5. `LLM-42 @10%` (Purple line)
6. `LLM-42 @20%` (Brown line)
7. `LLM-42 @50%` (Pink line)
8. `LLM-42 @100%` (Cyan line)
* **Grid:** Light gray dashed grid lines are present for both axes.
### Detailed Analysis
The chart plots eight distinct data series. Each line represents the CDF for a specific system/configuration, showing the fraction of requests (Y-axis) that complete within a given latency (X-axis).
**Trend Verification & Data Point Extraction (Approximate):**
All lines start at (0, 0) and approach a CDF of 1.0 (100% completion) as latency increases. The key difference is the rate of ascent.
1. **SGLang non-deterministic (Green):** Steepest initial slope. Reaches CDF ~0.9 by ~10,000 ms and CDF ~1.0 by ~20,000 ms.
2. **SGLang deterministic (Red):** Very similar to the green line, with a marginally slower ascent. Reaches CDF ~0.9 by ~12,000 ms and CDF ~1.0 by ~25,000 ms.
3. **LLM-42 @2% (Blue):** The slowest ascending line. Reaches CDF ~0.5 by ~20,000 ms, CDF ~0.8 by ~40,000 ms, and CDF ~0.95 by ~80,000 ms. It approaches 1.0 near 140,000 ms.
4. **LLM-42 @5% (Orange):** Very close to the green and red SGLang lines, nearly overlapping with them in the initial rise. Reaches CDF ~0.9 by ~12,000 ms.
5. **LLM-42 @10% (Purple):** Slightly slower than the @5% line. Reaches CDF ~0.9 by ~15,000 ms.
6. **LLM-42 @20% (Brown):** Noticeably slower than the @10% line. Reaches CDF ~0.8 by ~20,000 ms and CDF ~0.95 by ~40,000 ms.
7. **LLM-42 @50% (Pink):** Slower still. Reaches CDF ~0.6 by ~20,000 ms, CDF ~0.8 by ~40,000 ms, and CDF ~0.95 by ~80,000 ms.
8. **LLM-42 @100% (Cyan):** The second slowest line, closely following the blue @2% line but slightly above it for most of the curve. Reaches CDF ~0.6 by ~25,000 ms and CDF ~0.9 by ~60,000 ms.
**Spatial Grounding & Cross-Reference:**
* The legend is positioned in the center-right, overlapping the upper portion of the curves.
* The **fastest group** (steepest curves, reaching high CDF at low latency) consists of: `SGLang non-deterministic` (green), `SGLang deterministic` (red), `LLM-42 @5%` (orange), and `LLM-42 @10%` (purple). These are tightly clustered in the top-left region of the plot.
* The **slowest group** (most gradual curves) consists of: `LLM-42 @2%` (blue) and `LLM-42 @100%` (cyan). These two lines are very close together, forming the lower boundary of the curve bundle.
* The `LLM-42 @20%` (brown) and `LLM-42 @50%` (pink) lines occupy the middle ground between the fast and slow groups.
### Key Observations
1. **Clear Performance Tiers:** There is a distinct separation between the high-performance tier (SGLang modes and LLM-42 @5%/10%) and the lower-performance tier (LLM-42 @2% and @100%).
2. **Non-Monotonic Relationship with Percentage:** For LLM-42, performance does not improve linearly with the percentage parameter. The best performance is seen at @5% and @10%, while both lower (@2%) and higher (@50%, @100%) percentages result in significantly worse latency distributions.
3. **SGLang Deterministic vs. Non-deterministic:** The deterministic mode (red) has a very slightly worse latency profile than the non-deterministic mode (green), but the difference is minimal.
4. **Convergence at High Latency:** All configurations eventually reach a CDF of 1.0, meaning all requests complete given enough time (up to ~140 seconds for the slowest). The critical difference is in the "tail latency" – the time required to complete the last 5-10% of requests.
### Interpretation
This chart is a performance benchmark likely comparing different serving or inference systems for large language models (LLMs). The CDF format is excellent for understanding not just average latency, but the entire distribution, which is critical for service-level agreements (SLAs).
* **What the data suggests:** The `SGLang` systems and `LLM-42` configured with a 5% or 10% parameter offer the best and most consistent latency. They handle the vast majority of requests (e.g., 90%) in under 15-20 seconds. The `LLM-42 @2%` and `@100%` configurations have much heavier tails, meaning a significant fraction of users would experience wait times of 40 seconds or more.
* **Why the non-monotonic trend?** The percentage parameter (`@X%`) likely controls a resource allocation or batching strategy. The optimal point (@5-10%) suggests a "sweet spot." Too low (@2%) may underutilize resources, while too high (@50-100%) may cause contention, queuing, or inefficient batching, degrading performance.
* **Practical Implication:** For a production system prioritizing low and predictable latency, `SGLang` or `LLM-42` tuned to 5-10% would be preferable. The `LLM-42 @100%` configuration, while perhaps maximizing throughput in some other metric, comes at a severe cost to tail latency. The chart argues strongly against using the extreme percentage settings for latency-sensitive applications.