## CDF Graph: Latency Distribution Comparison
### Overview
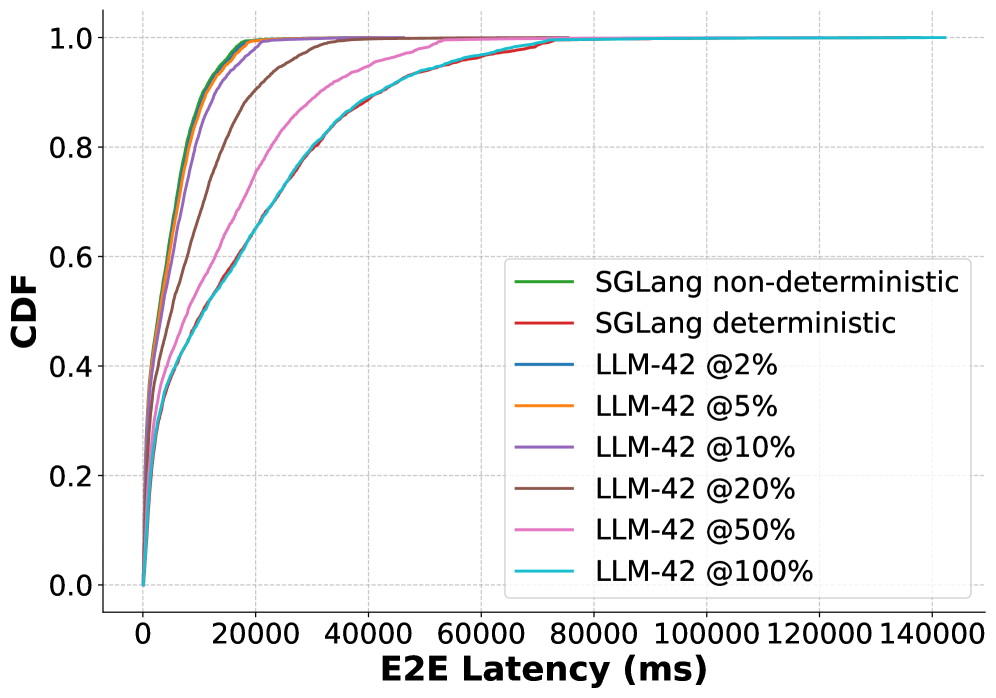
The image shows a cumulative distribution function (CDF) graph comparing latency distributions across different configurations. The x-axis represents end-to-end (E2E) latency in milliseconds (0–140,000 ms), and the y-axis represents the CDF (0–1.0). Seven data series are plotted, with distinct trends indicating performance differences between configurations.
### Components/Axes
- **X-axis**: E2E Latency (ms) – Linear scale from 0 to 140,000 ms.
- **Y-axis**: CDF – Linear scale from 0.0 to 1.0.
- **Legend**: Located in the bottom-right corner, mapping colors to configurations:
- Green: SGLang non-deterministic
- Red: SGLang deterministic
- Blue: LLM-42 @2%
- Orange: LLM-42 @5%
- Purple: LLM-42 @10%
- Brown: LLM-42 @20%
- Pink: LLM-42 @50%
- Cyan: LLM-42 @100%
### Detailed Analysis
1. **SGLang non-deterministic (Green)**:
- Sharp rise to 1.0 CDF by ~20,000 ms.
- Reaches 0.8 CDF at ~10,000 ms.
- Minimal tail latency beyond 20,000 ms.
2. **SGLang deterministic (Red)**:
- Similar to non-deterministic but slightly slower.
- Reaches 1.0 CDF by ~25,000 ms.
- 0.8 CDF at ~12,000 ms.
3. **LLM-42 @2% (Blue)**:
- Slower than SGLang; 1.0 CDF at ~40,000 ms.
- 0.8 CDF at ~25,000 ms.
- Longer tail latency extending to 80,000 ms.
4. **LLM-42 @5% (Orange)**:
- 1.0 CDF at ~50,000 ms.
- 0.8 CDF at ~35,000 ms.
- Tail latency up to 100,000 ms.
5. **LLM-42 @10% (Purple)**:
- 1.0 CDF at ~60,000 ms.
- 0.8 CDF at ~45,000 ms.
- Tail latency to 120,000 ms.
6. **LLM-42 @20% (Brown)**:
- 1.0 CDF at ~70,000 ms.
- 0.8 CDF at ~55,000 ms.
- Tail latency to 130,000 ms.
7. **LLM-42 @50% (Pink)**:
- 1.0 CDF at ~80,000 ms.
- 0.8 CDF at ~65,000 ms.
- Tail latency to 140,000 ms.
8. **LLM-42 @100% (Cyan)**:
- Slowest distribution; 1.0 CDF at ~90,000 ms.
- 0.8 CDF at ~75,000 ms.
- Flat plateau beyond 90,000 ms.
### Key Observations
- **SGLang Dominance**: Both SGLang configurations (green/red) achieve 1.0 CDF at latencies 2–3x lower than LLM-42 @2%.
- **Determinism Impact**: SGLang deterministic (red) is marginally slower than non-deterministic (green), suggesting minimal overhead from determinism.
- **LLM-42 Scaling**: Higher percentiles (e.g., 50%, 100%) correlate with progressively longer latencies and heavier tails.
- **Cyan Line Anomaly**: LLM-42 @100% plateaus at ~90,000 ms, indicating a hard cap on latency for this configuration.
### Interpretation
The data demonstrates that SGLang configurations (non-deterministic and deterministic) consistently outperform LLM-42 across all latency percentiles. The deterministic variant of SGLang introduces only a minor latency penalty (~5,000 ms difference in 1.0 CDF), suggesting that determinism does not significantly degrade performance in this context.
LLM-42's latency increases with higher percentiles, indicating that a larger proportion of requests experience longer delays. The @100% configuration (cyan) shows a flat tail, implying that 100% of requests complete within ~90,000 ms, but with substantial variability in lower percentiles. This could reflect resource contention or inefficiencies in handling edge cases.
For latency-sensitive applications, SGLang is preferable, while LLM-42 may be suitable for scenarios where higher percentiles are acceptable. The deterministic vs. non-deterministic tradeoff in SGLang appears negligible here, prioritizing consistency over marginal speed gains.