## Line Chart: Accuracy vs. Completion Tokens
### Overview
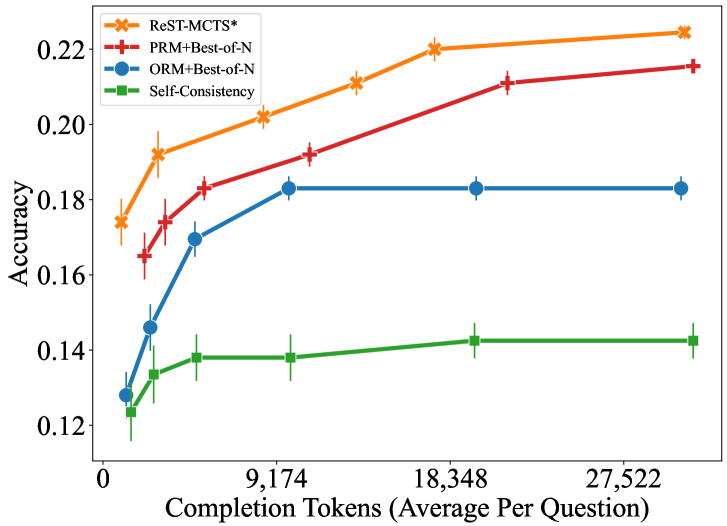
The image is a line chart comparing the accuracy of four different methods ("ReST-MCTS*", "PRM+Best-of-N", "ORM+Best-of-N", and "Self-Consistency") as a function of the number of completion tokens (average per question). The x-axis represents the number of completion tokens, and the y-axis represents accuracy. Error bars are present for each data point.
### Components/Axes
* **X-axis:** Completion Tokens (Average Per Question). Scale ranges from 0 to 27,522, with markers at 0, 9,174, 18,348, and 27,522.
* **Y-axis:** Accuracy. Scale ranges from 0.12 to 0.22, with markers at 0.12, 0.14, 0.16, 0.18, 0.20, and 0.22.
* **Legend (Top-Left):**
* Orange line with 'x' markers: ReST-MCTS*
* Red line with '+' markers: PRM+Best-of-N
* Blue line with 'o' markers: ORM+Best-of-N
* Green line with square markers: Self-Consistency
### Detailed Analysis
* **ReST-MCTS* (Orange, 'x' markers):** The line slopes upward, indicating increasing accuracy with more completion tokens.
* At 0 tokens: Accuracy ~0.175 +/- 0.005
* At 2,000 tokens: Accuracy ~0.192 +/- 0.005
* At 9,174 tokens: Accuracy ~0.202 +/- 0.005
* At 18,348 tokens: Accuracy ~0.220 +/- 0.005
* At 27,522 tokens: Accuracy ~0.223 +/- 0.005
* **PRM+Best-of-N (Red, '+' markers):** The line slopes upward, indicating increasing accuracy with more completion tokens.
* At 0 tokens: Accuracy ~0.170 +/- 0.005
* At 2,000 tokens: Accuracy ~0.175 +/- 0.005
* At 9,174 tokens: Accuracy ~0.190 +/- 0.005
* At 18,348 tokens: Accuracy ~0.210 +/- 0.005
* At 27,522 tokens: Accuracy ~0.215 +/- 0.005
* **ORM+Best-of-N (Blue, 'o' markers):** The line slopes upward initially, then plateaus, indicating that accuracy increases initially with more completion tokens, but then stabilizes.
* At 0 tokens: Accuracy ~0.128 +/- 0.005
* At 2,000 tokens: Accuracy ~0.145 +/- 0.005
* At 9,174 tokens: Accuracy ~0.170 +/- 0.005
* At 18,348 tokens: Accuracy ~0.183 +/- 0.005
* At 27,522 tokens: Accuracy ~0.183 +/- 0.005
* **Self-Consistency (Green, square markers):** The line is relatively flat, indicating that accuracy remains relatively constant with more completion tokens.
* At 0 tokens: Accuracy ~0.127 +/- 0.005
* At 2,000 tokens: Accuracy ~0.135 +/- 0.005
* At 9,174 tokens: Accuracy ~0.138 +/- 0.005
* At 18,348 tokens: Accuracy ~0.142 +/- 0.005
* At 27,522 tokens: Accuracy ~0.142 +/- 0.005
### Key Observations
* ReST-MCTS* consistently achieves the highest accuracy across all completion token values.
* Self-Consistency consistently achieves the lowest accuracy across all completion token values.
* ORM+Best-of-N shows a significant increase in accuracy initially, but plateaus at higher completion token values.
* All methods show some improvement in accuracy with increasing completion tokens, except for Self-Consistency, which remains relatively stable.
### Interpretation
The data suggests that increasing the number of completion tokens (average per question) generally improves the accuracy of the tested methods. However, the extent of improvement varies depending on the method used. ReST-MCTS* appears to be the most effective method, achieving the highest accuracy and showing a consistent increase with more tokens. Self-Consistency, on the other hand, seems to be less sensitive to the number of completion tokens. The plateauing of ORM+Best-of-N suggests that there may be a point of diminishing returns for this method in terms of accuracy improvement with more tokens. The error bars indicate the uncertainty in the accuracy measurements, which should be considered when interpreting the results.