## Line Chart: Accuracy vs. Completion Tokens
### Overview
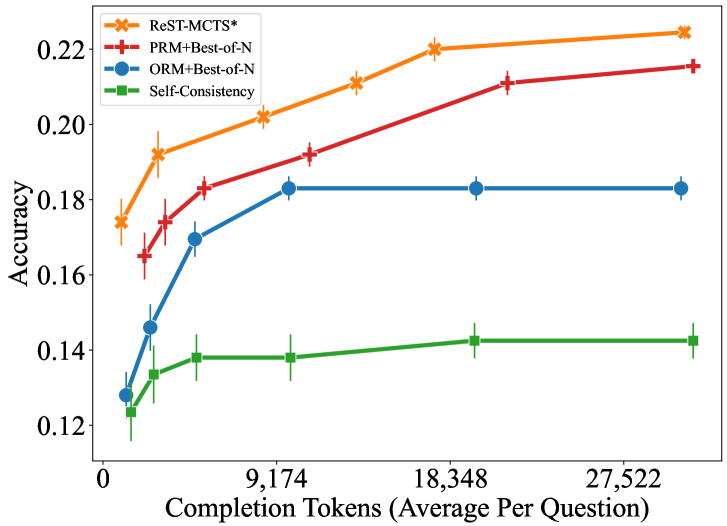
This chart illustrates the performance (Accuracy) of four different computational methods—ReST-MCTS*, PRM+Best-of-N, ORM+Best-of-N, and Self-Consistency—plotted against the computational cost, measured as "Completion Tokens (Average Per Question)." The chart demonstrates that increasing the number of completion tokens generally leads to higher accuracy, though the rate of improvement and the performance ceiling vary significantly by method.
### Components/Axes
* **Y-Axis:** Labeled "Accuracy." The scale ranges from 0.12 to 0.22, with increments of 0.02.
* **X-Axis:** Labeled "Completion Tokens (Average Per Question)." The scale ranges from 0 to approximately 27,522. Major tick marks are provided at 0, 9,174, 18,348, and 27,522.
* **Legend:** Positioned in the top-left corner of the chart area.
* **Orange (X marker):** ReST-MCTS*
* **Red (+ marker):** PRM+Best-of-N
* **Blue (Circle marker):** ORM+Best-of-N
* **Green (Square marker):** Self-Consistency
* **Visual Elements:** Each data point includes vertical error bars, indicating uncertainty or variance in the measurements.
### Detailed Analysis
The chart displays four distinct data series, all showing a positive correlation between token count and accuracy.
1. **ReST-MCTS* (Orange, X):**
* **Trend:** This series shows the highest accuracy across all token counts and maintains a consistent upward slope throughout the entire range.
* **Data Points:** Starts at approximately 0.175 accuracy at the lowest token count. It rises steadily, reaching approximately 0.192, 0.202, 0.212, 0.220, and finally peaking near 0.225 at the maximum token count.
2. **PRM+Best-of-N (Red, +):**
* **Trend:** This series is the second most accurate. It shows a consistent upward slope, similar to ReST-MCTS*, but consistently tracks below it.
* **Data Points:** Starts at approximately 0.165. It rises to roughly 0.174, 0.183, 0.192, 0.211, and ends near 0.216.
3. **ORM+Best-of-N (Blue, Circle):**
* **Trend:** This series shows a sharp initial increase in accuracy, followed by a distinct plateau.
* **Data Points:** Starts at approximately 0.128. It rises sharply to roughly 0.146 and 0.170, then plateaus at approximately 0.183 for the remainder of the token range.
4. **Self-Consistency (Green, Square):**
* **Trend:** This series shows the lowest accuracy overall. Like the ORM method, it exhibits a sharp initial rise followed by a plateau.
* **Data Points:** Starts at approximately 0.124. It rises to roughly 0.134 and 0.138, then plateaus at approximately 0.143 for the remainder of the token range.
### Key Observations
* **Performance Ceiling:** The ORM+Best-of-N and Self-Consistency methods exhibit diminishing returns, plateauing after approximately 9,000 tokens. They do not appear to benefit significantly from additional token allocation beyond this point.
* **Scalability:** ReST-MCTS* and PRM+Best-of-N demonstrate better scalability, as their accuracy continues to improve as the average number of completion tokens increases.
* **Methodological Superiority:** ReST-MCTS* consistently outperforms the other three methods across the entire spectrum of token counts.
### Interpretation
The data suggests a clear hierarchy in the effectiveness of these methods for improving model accuracy. The divergence between the "plateauing" methods (ORM and Self-Consistency) and the "scaling" methods (ReST-MCTS* and PRM) indicates that the latter are more robust strategies for leveraging increased computational resources.
The fact that PRM (Process Reward Model) outperforms ORM (Outcome Reward Model) suggests that rewarding the process of reasoning (step-by-step) is more effective than simply rewarding the final outcome, especially as the model is allowed to generate more tokens. ReST-MCTS* appears to be the most efficient and effective approach, likely because it integrates search-based optimization (MCTS) with the reward model, allowing for more intelligent exploration of the solution space compared to the "Best-of-N" sampling approaches.