## Line Chart: Accuracy vs. Completion Tokens for Different Methods
### Overview
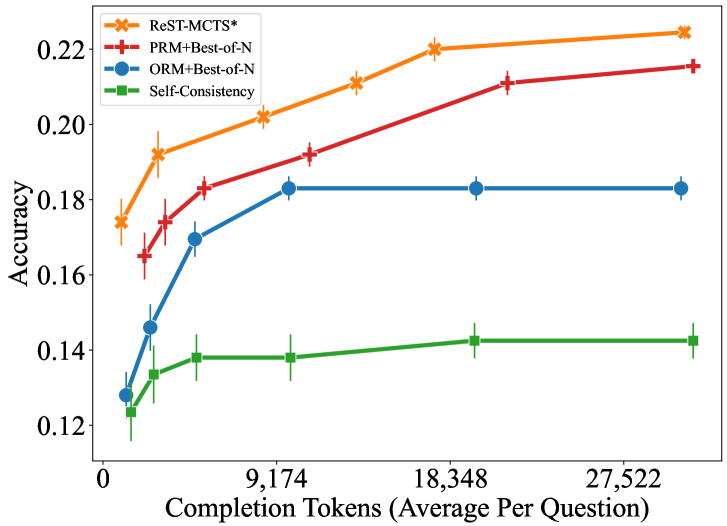
This line chart displays the accuracy of four different methods (ReST-MCTS*, PRM+Best-of-N, ORM+Best-of-N, and Self-Consistency) as a function of completion tokens used, averaged per question. Error bars are included for each data point.
### Components/Axes
* **X-axis:** Completion Tokens (Average Per Question). Scale ranges from 0 to 27,522, with markers at 0, 9,174, 18,348, and 27,522.
* **Y-axis:** Accuracy. Scale ranges from 0.12 to 0.22.
* **Legend:** Located in the top-right corner.
* ReST-MCTS* (Orange)
* PRM+Best-of-N (Red)
* ORM+Best-of-N (Blue)
* Self-Consistency (Green)
### Detailed Analysis
Here's a breakdown of each line's trend and approximate data points, verified against the legend colors:
* **ReST-MCTS* (Orange):** The line slopes upward, indicating increasing accuracy with more completion tokens.
* 0 Tokens: Approximately 0.175 ± 0.015
* 9,174 Tokens: Approximately 0.195 ± 0.015
* 18,348 Tokens: Approximately 0.21 ± 0.01
* 27,522 Tokens: Approximately 0.225 ± 0.01
* **PRM+Best-of-N (Red):** The line also slopes upward, but with a diminishing rate of increase.
* 0 Tokens: Approximately 0.165 ± 0.01
* 9,174 Tokens: Approximately 0.19 ± 0.01
* 18,348 Tokens: Approximately 0.205 ± 0.01
* 27,522 Tokens: Approximately 0.215 ± 0.01
* **ORM+Best-of-N (Blue):** The line increases sharply initially, then plateaus.
* 0 Tokens: Approximately 0.145 ± 0.01
* 9,174 Tokens: Approximately 0.18 ± 0.01
* 18,348 Tokens: Approximately 0.185 ± 0.01
* 27,522 Tokens: Approximately 0.185 ± 0.01
* **Self-Consistency (Green):** The line shows a slight upward trend, but remains relatively flat.
* 0 Tokens: Approximately 0.13 ± 0.01
* 9,174 Tokens: Approximately 0.14 ± 0.01
* 18,348 Tokens: Approximately 0.145 ± 0.01
* 27,522 Tokens: Approximately 0.15 ± 0.01
### Key Observations
* ReST-MCTS* consistently achieves the highest accuracy across all completion token values.
* ORM+Best-of-N shows a rapid initial improvement in accuracy, but then levels off, suggesting diminishing returns from additional tokens.
* Self-Consistency exhibits the lowest accuracy and the smallest improvement with increasing tokens.
* The error bars indicate some variability in the accuracy measurements, but the overall trends are clear.
### Interpretation
The chart demonstrates the relationship between the number of completion tokens used and the accuracy of different methods for a question-answering or reasoning task. The methods leverage different approaches to improve performance, and the chart reveals their respective scaling behaviors. ReST-MCTS* appears to benefit most from increased computational resources (represented by completion tokens), while ORM+Best-of-N reaches a point of diminishing returns. Self-Consistency shows limited improvement, suggesting it may be less sensitive to the number of tokens or require a different optimization strategy. The differences in performance suggest that the methods employ different strategies for exploring the solution space, with ReST-MCTS* being the most effective at leveraging additional computational resources to find more accurate answers. The error bars suggest that the results are statistically significant, but there is still some inherent variability in the performance of each method.