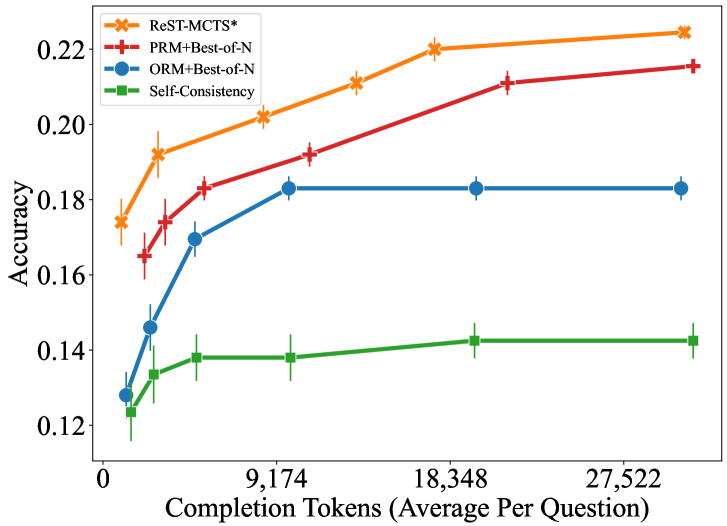
## Line Graph: Accuracy vs. Completion Tokens (Average Per Question)
### Overview
The graph compares the accuracy of four different methods (ReST-MCTS*, PRM+Best-of-N, ORM+Best-of-N, Self-Consistency) across varying numbers of completion tokens (average per question). Accuracy is measured on the y-axis (0.12–0.22), while the x-axis represents completion tokens in increments of ~9,174 (0, 9,174, 18,348, 27,522). Error bars indicate variability in accuracy measurements.
### Components/Axes
- **X-axis**: Completion Tokens (Average Per Question)
Labels: 0, 9,174, 18,348, 27,522
- **Y-axis**: Accuracy (0.12–0.22)
- **Legend**: Top-left corner, with four entries:
- ReST-MCTS* (orange, "x" markers)
- PRM+Best-of-N (red, "+" markers)
- ORM+Best-of-N (blue, "o" markers)
- Self-Consistency (green, "□" markers)
### Detailed Analysis
1. **ReST-MCTS***
- Starts at ~0.175 accuracy at 0 tokens, rising steadily to ~0.225 at 27,522 tokens.
- Error bars shrink slightly as token count increases.
- **Trend**: Consistent upward slope.
2. **PRM+Best-of-N**
- Begins at ~0.165 accuracy at 0 tokens, increasing to ~0.215 at 27,522 tokens.
- Error bars remain moderate throughout.
- **Trend**: Steeper upward trajectory than ReST-MCTS*.
3. **ORM+Best-of-N**
- Starts at ~0.125 accuracy at 0 tokens, jumps to ~0.185 at 9,174 tokens, then plateaus.
- Error bars are large initially, stabilizing after 9,174 tokens.
- **Trend**: Sharp initial increase, followed by flatline.
4. **Self-Consistency**
- Begins at ~0.12 accuracy at 0 tokens, rising to ~0.145 at 27,522 tokens.
- Error bars are smallest among all methods.
- **Trend**: Gradual, linear increase.
### Key Observations
- **ReST-MCTS* and PRM+Best-of-N** show the strongest performance, with ReST-MCTS* achieving the highest accuracy (~0.225) at maximum tokens.
- **ORM+Best-of-N** exhibits a plateau after 9,174 tokens, suggesting diminishing returns.
- **Self-Consistency** has the lowest accuracy but also the smallest error margins, indicating higher reliability in its measurements.
- All methods improve with more tokens, but the rate of improvement varies significantly.
### Interpretation
The data suggests that **ReST-MCTS* and PRM+Best-of-N** are the most effective methods for improving accuracy with increased computational resources (tokens). ORM+Best-of-N’s plateau implies it may not benefit from additional tokens beyond 9,174. Self-Consistency’s steady but modest gains highlight its limitations compared to other methods. The error bars suggest that ReST-MCTS* and PRM+Best-of-N have higher variability in performance, potentially due to more complex or stochastic processes. This graph underscores the trade-off between token efficiency and accuracy across different approaches.