## Diagram: Network Graph
### Overview
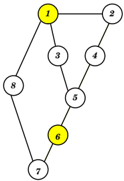
The image shows a network graph with 8 nodes, numbered 1 through 8. The nodes are connected by lines, representing edges. Nodes 1 and 6 are highlighted in yellow.
### Components/Axes
* **Nodes:** 8 nodes, labeled 1 through 8.
* **Edges:** Lines connecting the nodes, representing relationships or connections.
* **Highlighted Nodes:** Nodes 1 and 6 are highlighted in yellow.
### Detailed Analysis
The network graph shows the following connections:
* Node 1 is connected to nodes 2, 3, and 8.
* Node 2 is connected to nodes 1 and 4.
* Node 3 is connected to nodes 1 and 5.
* Node 4 is connected to nodes 2 and 5.
* Node 5 is connected to nodes 3, 4, and 6.
* Node 6 is connected to nodes 5 and 7.
* Node 7 is connected to nodes 6 and 8.
* Node 8 is connected to nodes 1 and 7.
### Key Observations
* Nodes 1 and 6 are highlighted, possibly indicating their importance or a specific role in the network.
* Node 5 has the highest degree (number of connections), with connections to nodes 3, 4, and 6.
* The graph appears to be undirected, as the connections are represented by simple lines without arrows.
### Interpretation
The network graph visually represents relationships between different entities (nodes). The highlighted nodes (1 and 6) may represent key elements or starting/ending points in a process. The connections (edges) indicate interactions or dependencies between these entities. The structure of the graph can be analyzed to understand the flow of information, resources, or influence within the network. The high degree of Node 5 suggests it plays a central role in the network.