## Line Graph: Comparison of Non-Disabled and Disabled Groups
### Overview
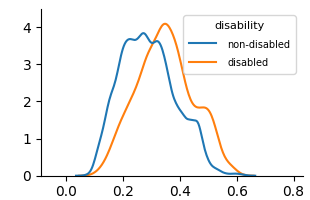
The image is a line graph comparing two data series: "non-disabled" (blue line) and "disabled" (orange line). Both lines represent values on a y-axis (0–4) across an x-axis (0.0–0.8). The graph includes a legend in the top-right corner and axis markers at regular intervals.
### Components/Axes
- **X-axis**: Labeled "x-axis," with markers at 0.0, 0.2, 0.4, 0.6, and 0.8.
- **Y-axis**: Labeled "y-axis," with markers at 0, 1, 2, 3, and 4.
- **Legend**: Located in the top-right corner, with:
- Blue line: "non-disabled"
- Orange line: "disabled"
### Detailed Analysis
1. **Non-Disabled (Blue Line)**:
- Starts at 0.0 on the x-axis with a value of ~0.2 on the y-axis.
- Rises sharply to a peak of ~3.8 at x = 0.3.
- Declines gradually to ~1.5 at x = 0.6, then flattens near 0.0 by x = 0.8.
2. **Disabled (Orange Line)**:
- Begins at x = 0.0 with a value of ~0.1 on the y-axis.
- Rises more gradually than the blue line, peaking at ~4.2 at x = 0.35.
- Drops sharply to ~1.0 at x = 0.6, then declines further to ~0.2 by x = 0.8.
### Key Observations
- The orange ("disabled") line surpasses the blue ("non-disabled") line in peak height (~4.2 vs. ~3.8) and occurs slightly later (x = 0.35 vs. x = 0.3).
- The orange line exhibits a steeper decline after its peak compared to the blue line.
- The two lines intersect near x = 0.3–0.35, where the orange line overtakes the blue line.
### Interpretation
The data suggests that the "disabled" group exhibits a higher initial value and a more pronounced peak compared to the "non-disabled" group. However, the "disabled" group also experiences a sharper decline post-peak, indicating a potential divergence in trends or characteristics between the two groups. The crossing point (~x = 0.3–0.35) may represent a critical threshold where the two groups' metrics diverge significantly. Without contextual labels for the axes, the exact nature of the measured variable remains unclear, but the visual disparity highlights distinct patterns in the datasets.