# Technical Document Extraction: Edge Relationship Diagram
## Diagram Overview
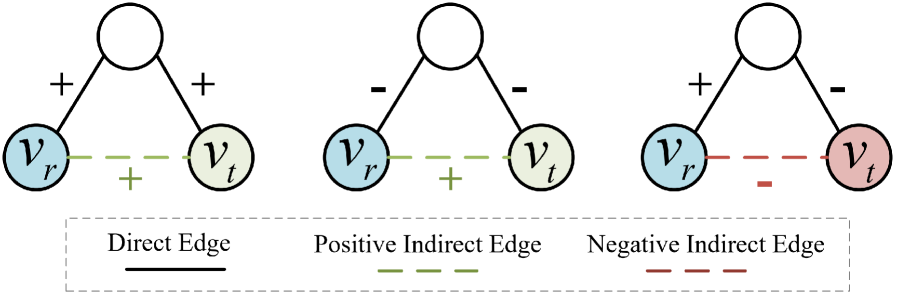
The image contains three distinct diagrams illustrating different edge relationships between nodes `V_r` (source) and `V_t` (target), connected through a central node. Each diagram uses standardized visual conventions for edge types and node relationships.
---
## Diagram Components
### 1. Direct Edge
- **Nodes**:
- `V_r` (blue circle, left)
- Central node (white circle, top)
- `V_t` (green circle, right)
- **Edges**:
- Central node → `V_r`: Solid black line with `+` sign
- Central node → `V_t`: Solid black line with `+` sign
- `V_r` ↔ `V_t`: Solid black line (Direct Edge)
- **Legend Reference**: Solid black line = Direct Edge
### 2. Positive Indirect Edge
- **Nodes**:
- `V_r` (blue circle, left)
- Central node (white circle, top)
- `V_t` (green circle, right)
- **Edges**:
- Central node → `V_r`: Dashed black line with `-` sign
- Central node → `V_t`: Dashed black line with `-` sign
- `V_r` ↔ `V_t`: Dashed green line (Positive Indirect Edge)
- **Legend Reference**: Dashed green line = Positive Indirect Edge
### 3. Negative Indirect Edge
- **Nodes**:
- `V_r` (blue circle, left)
- Central node (white circle, top)
- `V_t` (red circle, right)
- **Edges**:
- Central node → `V_r`: Solid black line with `+` sign
- Central node → `V_t`: Dashed black line with `-` sign
- `V_r` ↔ `V_t`: Dashed red line (Negative Indirect Edge)
- **Legend Reference**: Dashed red line = Negative Indirect Edge
---
## Legend Analysis
- **Location**: Bottom of the image, spanning full width
- **Entries**:
1. **Direct Edge**: Solid black line (✓ Matches Diagram 1)
2. **Positive Indirect Edge**: Dashed green line (✓ Matches Diagram 2)
3. **Negative Indirect Edge**: Dashed red line (✓ Matches Diagram 3)
---
## Spatial Grounding
- **Legend Position**: `[x: 0, y: bottom]` (aligned with diagram bases)
- **Node Positioning**:
- `V_r`: Leftmost position in all diagrams
- Central node: Top center in all diagrams
- `V_t`: Rightmost position in all diagrams
---
## Trend Verification
- **Direct Edge**: All connections positive (✓ Consistent `+` signs)
- **Positive Indirect Edge**: Central node connections negative, but indirect edge positive (✓ Dashed green line)
- **Negative Indirect Edge**: Mixed central node connections (positive → `V_r`, negative → `V_t`), resulting in negative indirect edge (✓ Dashed red line)
---
## Data Structure (Hypothetical)
If converted to a table, the structure would be:
| Edge Type | Connection | Color | Style | Sign |
|------------------------|------------------|-----------|-----------|------|
| Direct Edge | `V_r` ↔ `V_t` | Black | Solid | + |
| Positive Indirect Edge | `V_r` ↔ `V_t` | Green | Dashed | + |
| Negative Indirect Edge | `V_r` ↔ `V_t` | Red | Dashed | - |
---
## Key Observations
1. **Color Coding**:
- Node colors differentiate `V_r` (blue), `V_t` (green/red), and central node (white).
- Edge colors/styles encode relationship type (solid/black = direct, dashed/colored = indirect).
2. **Significance of Signs**:
- `+` signs indicate positive influence from central node.
- `-` signs indicate negative influence from central node.
3. **Indirect Edge Logic**:
- Positive indirect edge occurs when central node connections are negative but indirect edge is positive.
- Negative indirect edge occurs when central node connections are mixed (positive → `V_r`, negative → `V_t`).
---
## Missing Elements
- No numerical data or quantitative values present.
- No axis titles or scales (purely symbolic diagram).
- No additional textual annotations beyond labels and legend.
---
## Conclusion
This diagram set visually encodes three edge relationship types using standardized color, style, and sign conventions. The relationships are defined by both direct connections and indirect paths through a central node, with polarity determined by edge signs and types.