## Diagram: Graph Edge Types
### Overview
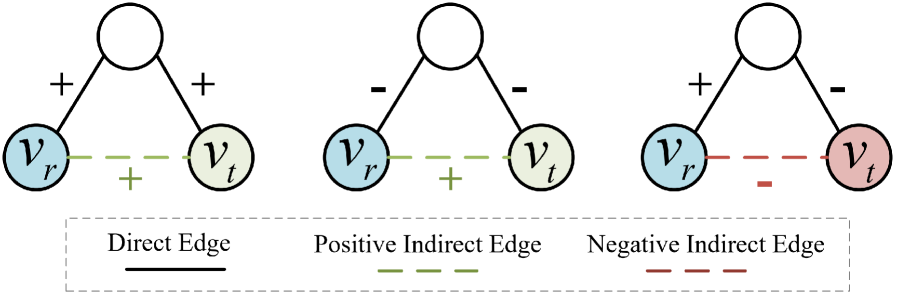
The image illustrates three different types of edges in a graph: Direct Edge, Positive Indirect Edge, and Negative Indirect Edge. Each example shows a simple graph with a root node connected to two child nodes, labeled *v<sub>r</sub>* and *v<sub>t</sub>*. The color of the node *v<sub>r</sub>* and *v<sub>t</sub>* changes depending on the type of edge.
### Components/Axes
* **Nodes:** Each graph consists of three nodes represented by circles. The top node is unlabeled. The bottom left node is labeled *v<sub>r</sub>*, and the bottom right node is labeled *v<sub>t</sub>*.
* **Edges:** The edges connecting the top node to *v<sub>r</sub>* and *v<sub>t</sub>* are solid lines, labeled with "+" or "-". The edges between *v<sub>r</sub>* and *v<sub>t</sub>* are dashed lines, also labeled with "+" or "-".
* **Legend:** Located at the bottom of the image, enclosed in a dashed gray box.
* **Direct Edge:** Represented by a solid black line.
* **Positive Indirect Edge:** Represented by a dashed green line.
* **Negative Indirect Edge:** Represented by a dashed brown line.
### Detailed Analysis
**Graph 1 (Left): Direct Edge**
* The edge from the top node to *v<sub>r</sub>* is labeled "+".
* The edge from the top node to *v<sub>t</sub>* is labeled "+".
* Node *v<sub>r</sub>* is colored light blue.
* Node *v<sub>t</sub>* is colored light green.
* The edge between *v<sub>r</sub>* and *v<sub>t</sub>* is a dashed green line, labeled "+". This corresponds to the "Positive Indirect Edge" in the legend.
**Graph 2 (Middle): Positive Indirect Edge**
* The edge from the top node to *v<sub>r</sub>* is labeled "-".
* The edge from the top node to *v<sub>t</sub>* is labeled "-".
* Node *v<sub>r</sub>* is colored light blue.
* Node *v<sub>t</sub>* is colored light green.
* The edge between *v<sub>r</sub>* and *v<sub>t</sub>* is a dashed green line, labeled "+". This corresponds to the "Positive Indirect Edge" in the legend.
**Graph 3 (Right): Negative Indirect Edge**
* The edge from the top node to *v<sub>r</sub>* is labeled "+".
* The edge from the top node to *v<sub>t</sub>* is labeled "-".
* Node *v<sub>r</sub>* is colored light blue.
* Node *v<sub>t</sub>* is colored light red.
* The edge between *v<sub>r</sub>* and *v<sub>t</sub>* is a dashed brown line, labeled "-". This corresponds to the "Negative Indirect Edge" in the legend.
### Key Observations
* The color of the nodes *v<sub>r</sub>* and *v<sub>t</sub>* changes based on the type of indirect edge.
* The signs ("+" or "-") on the edges from the top node to *v<sub>r</sub>* and *v<sub>t</sub>* seem to influence the type of indirect edge.
* The sign on the indirect edge between *v<sub>r</sub>* and *v<sub>t</sub>* matches the description in the legend.
### Interpretation
The diagram illustrates how different combinations of direct edges (from the root node) and indirect edges (between the child nodes) can be classified. The signs on the direct edges, along with the resulting colors of the nodes *v<sub>r</sub>* and *v<sub>t</sub>*, determine whether the indirect edge is positive or negative. The diagram suggests a relationship between the signs of the direct edges and the type of indirect edge, potentially indicating a propagation or influence mechanism within the graph. The color of the node *v<sub>t</sub>* seems to be an indicator of the type of indirect edge.