# Technical Document Extraction: Graph Edge Relationship Diagram
## 1. Document Overview
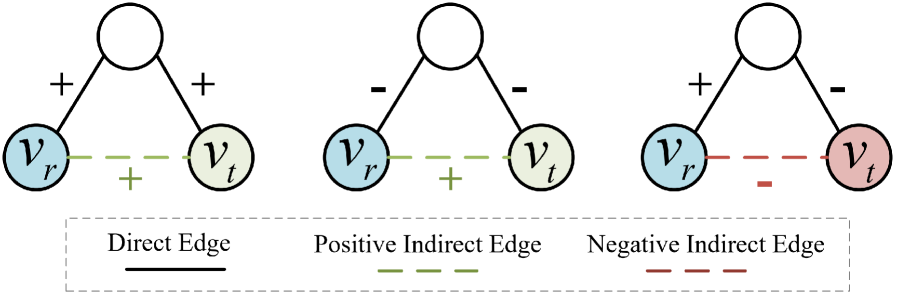
This image is a technical diagram illustrating the relationship between direct edges and indirect edges in a graph structure, likely representing social balance theory or signed network analysis. It consists of three distinct graph scenarios and a legend.
---
## 2. Component Isolation
### A. Legend (Footer Region)
Located at the bottom of the image within a dashed rectangular border.
* **Direct Edge:** Represented by a solid black line.
* **Positive Indirect Edge:** Represented by a dashed green line.
* **Negative Indirect Edge:** Represented by a dashed red line.
### B. Graph Scenarios (Main Chart Region)
The image contains three triangular graph structures. Each graph features a top unlabeled white node connected to two bottom nodes ($v_r$ and $v_t$) via direct edges. An indirect edge connects $v_r$ and $v_t$.
#### Scenario 1: Positive Indirect Relationship (Left)
* **Nodes:**
* Top: Unlabeled (White)
* Bottom Left: $v_r$ (Light Blue)
* Bottom Right: $v_t$ (Light Green)
* **Direct Edges (Solid Black):**
* Top to $v_r$: Labeled with a plus sign (**+**)
* Top to $v_t$: Labeled with a plus sign (**+**)
* **Indirect Edge (Dashed Green):**
* Between $v_r$ and $v_t$: Labeled with a plus sign (**+**)
* **Logic:** Two positive direct connections result in a **Positive Indirect Edge**.
#### Scenario 2: Positive Indirect Relationship (Center)
* **Nodes:**
* Top: Unlabeled (White)
* Bottom Left: $v_r$ (Light Blue)
* Bottom Right: $v_t$ (Light Green)
* **Direct Edges (Solid Black):**
* Top to $v_r$: Labeled with a minus sign (**-**)
* Top to $v_t$: Labeled with a minus sign (**-**)
* **Indirect Edge (Dashed Green):**
* Between $v_r$ and $v_t$: Labeled with a plus sign (**+**)
* **Logic:** Two negative direct connections result in a **Positive Indirect Edge** (The "enemy of my enemy is my friend" principle).
#### Scenario 3: Negative Indirect Relationship (Right)
* **Nodes:**
* Top: Unlabeled (White)
* Bottom Left: $v_r$ (Light Blue)
* Bottom Right: $v_t$ (Light Red/Pink)
* **Direct Edges (Solid Black):**
* Top to $v_r$: Labeled with a plus sign (**+**)
* Top to $v_t$: Labeled with a minus sign (**-**)
* **Indirect Edge (Dashed Red):**
* Between $v_r$ and $v_t$: Labeled with a minus sign (**-**)
* **Logic:** One positive and one negative direct connection result in a **Negative Indirect Edge**.
---
## 3. Data Summary Table
| Scenario | Edge (Top to $v_r$) | Edge (Top to $v_t$) | Resulting Indirect Edge ($v_r$ to $v_t$) | Indirect Edge Type |
| :--- | :--- | :--- | :--- | :--- |
| 1 | Positive (+) | Positive (+) | Positive (+) | Dashed Green |
| 2 | Negative (-) | Negative (-) | Positive (+) | Dashed Green |
| 3 | Positive (+) | Negative (-) | Negative (-) | Dashed Red |
---
## 4. Technical Observations
* **Node Color Coding:** The node $v_r$ is consistently light blue. The node $v_t$ changes color based on the relationship: light green for positive indirect relationships and light red for negative indirect relationships.
* **Mathematical Pattern:** The indirect edge sign follows the rules of multiplication for signed integers:
* $(+) \times (+) = (+)$
* $(-) \times (-) = (+)$
* $(+) \times (-) = (-)$