## Diagram: Signed Graph Edge Relationships
### Overview
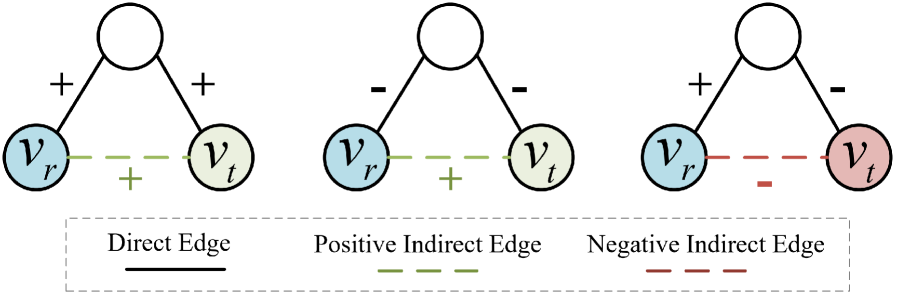
The image is a technical diagram illustrating three distinct configurations of signed relationships between nodes in a graph or network. It demonstrates how the signs of direct edges from a common intermediary node determine the nature of the indirect relationship between two terminal nodes, \( v_r \) and \( v_t \). The diagram is composed of three separate triangular structures arranged horizontally, with a legend below explaining the edge types.
### Components/Axes
* **Nodes:** Each of the three structures contains three nodes arranged in a triangle.
* **Top Node:** An unlabeled, white-filled circle at the apex of each triangle.
* **Bottom-Left Node:** A blue-filled circle labeled \( v_r \).
* **Bottom-Right Node:** A circle labeled \( v_t \). Its fill color varies: light green in the first two structures, pink in the third.
* **Edges & Signs:**
* **Direct Edges:** Solid black lines connecting the top node to each bottom node (\( v_r \) and \( v_t \)). Each is annotated with a sign: `+` (positive) or `-` (negative).
* **Indirect Edge:** A dashed line connecting \( v_r \) and \( v_t \) directly. Its color and sign are determined by the configuration of the direct edges.
* **Legend:** A dashed-border box at the bottom center defines the edge types:
* `Direct Edge`: Represented by a solid black line.
* `Positive Indirect Edge`: Represented by a dashed green line.
* `Negative Indirect Edge`: Represented by a dashed red line.
### Detailed Analysis
The diagram presents three specific cases from left to right:
**1. Left Structure (Positive Indirect Relationship):**
* **Direct Edges:** Top node to \( v_r \) is `+`. Top node to \( v_t \) is `+`.
* **Indirect Edge:** A **dashed green line** connects \( v_r \) and \( v_t \), annotated with a `+` sign.
* **Interpretation:** Two positive direct relationships result in a positive indirect relationship between the endpoints.
**2. Middle Structure (Positive Indirect Relationship):**
* **Direct Edges:** Top node to \( v_r \) is `-`. Top node to \( v_t \) is `-`.
* **Indirect Edge:** A **dashed green line** connects \( v_r \) and \( v_t \), annotated with a `+` sign.
* **Interpretation:** Two negative direct relationships also result in a positive indirect relationship between the endpoints (the "enemy of my enemy is my friend" principle).
**3. Right Structure (Negative Indirect Relationship):**
* **Direct Edges:** Top node to \( v_r \) is `+`. Top node to \( v_t \) is `-`.
* **Indirect Edge:** A **dashed red line** connects \( v_r \) and \( v_t \), annotated with a `-` sign.
* **Interpretation:** A mix of one positive and one negative direct relationship results in a negative indirect relationship between the endpoints.
### Key Observations
* The color of the \( v_t \) node changes from light green (in positive indirect outcomes) to pink (in the negative indirect outcome), providing a visual cue for the result.
* The sign of the indirect edge is the **product** of the signs of the two direct edges: `(+) * (+) = (+)`, `(-) * (-) = (+)`, `(+) * (-) = (-)`.
* The diagram is a visual representation of **balance theory** or **structural balance** in signed graphs, often used in social network analysis, psychology, and game theory.
### Interpretation
This diagram is a foundational illustration of how local relationships (direct edges) propagate to determine global structure (indirect relationships) in a signed network. It encodes a simple algebraic rule: the sign of a path of length two is the product of the signs of its constituent edges.
The key insight is that **balanced triads** (where the product of all three edges in the triangle is positive) are stable. The first two structures are balanced (`+ * + * + = +` and `- * - * + = +`), while the third is unbalanced (`+ * - * - = +`? Wait, let's check: the direct edges are + and -, and the indirect is -. The product of all three edges is `+ * - * - = +`. Actually, all three shown triads are balanced according to the standard definition where the product of the three edge signs is positive. The third triad is balanced because the two negative edges (one direct, one indirect) make the product positive). The diagram effectively teaches the rule for inferring the likely relationship between two entities (\( v_r \) and \( v_t \)) based on their shared relationships with a common third party.