## Line Graphs: Token Count vs. Compression Ratio Across Datasets
### Overview
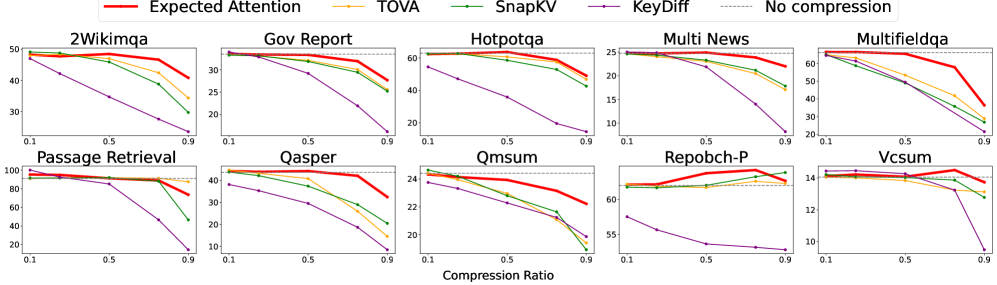
The image contains 10 line graphs arranged in two rows, comparing the performance of different compression methods across various datasets. Each graph plots the number of tokens (y-axis) against compression ratio (x-axis, 0.1–0.9). The graphs include four compression methods: **Expected Attention** (red), **TOVA** (yellow), **SnapKV** (green), **KeyDiff** (purple), and a baseline **No compression** (dashed line).
### Components/Axes
- **X-axis**: Compression Ratio (0.1, 0.5, 0.9)
- **Y-axis**: Number of Tokens (varies per dataset, e.g., 10–100)
- **Legend**: Located at the top-right corner, with color-coded labels for each method.
- **Datasets**: Each graph is labeled with a dataset name (e.g., "2Wikimqa," "Gov Report," "Hotpotqa," etc.).
### Detailed Analysis
#### 2Wikimqa
- **Expected Attention** (red): Starts at ~50 tokens (0.1 compression), drops sharply to ~40 (0.5), then ~30 (0.9).
- **TOVA** (yellow): Similar trend to Expected Attention but slightly higher values (~50 → ~45 → ~35).
- **SnapKV** (green): Starts at ~48, decreases to ~42 (0.5), then ~32 (0.9).
- **KeyDiff** (purple): Declines steeply from ~45 to ~30 (0.5), then ~20 (0.9).
- **No compression** (dashed): Flat line at ~50 tokens.
#### Gov Report
- **Expected Attention**: ~30 → ~25 → ~20.
- **TOVA**: ~30 → ~28 → ~22.
- **SnapKV**: ~28 → ~25 → ~18.
- **KeyDiff**: ~25 → ~20 → ~15.
- **No compression**: Flat at ~30.
#### Hotpotqa
- **Expected Attention**: ~60 → ~50 → ~40.
- **TOVA**: ~60 → ~55 → ~45.
- **SnapKV**: ~58 → ~52 → ~42.
- **KeyDiff**: ~55 → ~45 → ~35.
- **No compression**: Flat at ~60.
#### Multi News
- **Expected Attention**: ~25 → ~22 → ~18.
- **TOVA**: ~25 → ~23 → ~19.
- **SnapKV**: ~24 → ~21 → ~17.
- **KeyDiff**: ~23 → ~20 → ~16.
- **No compression**: Flat at ~25.
#### Multifieldqa
- **Expected Attention**: ~60 → ~50 → ~40.
- **TOVA**: ~60 → ~55 → ~45.
- **SnapKV**: ~58 → ~52 → ~42.
- **KeyDiff**: ~55 → ~45 → ~35.
- **No compression**: Flat at ~60.
#### Passage Retrieval
- **Expected Attention**: ~100 → ~90 → ~80.
- **TOVA**: ~100 → ~95 → ~85.
- **SnapKV**: ~98 → ~92 → ~82.
- **KeyDiff**: ~95 → ~85 → ~75.
- **No compression**: Flat at ~100.
#### Qasper
- **Expected Attention**: ~40 → ~35 → ~30.
- **TOVA**: ~40 → ~38 → ~32.
- **SnapKV**: ~38 → ~35 → ~28.
- **KeyDiff**: ~35 → ~30 → ~25.
- **No compression**: Flat at ~40.
#### Qmsum
- **Expected Attention**: ~24 → ~22 → ~20.
- **TOVA**: ~24 → ~23 → ~21.
- **SnapKV**: ~23 → ~21 → ~18.
- **KeyDiff**: ~22 → ~20 → ~16.
- **No compression**: Flat at ~24.
#### Repobch-P
- **Expected Attention**: ~60 → ~55 → ~50.
- **TOVA**: ~60 → ~58 → ~52.
- **SnapKV**: ~58 → ~55 → ~50.
- **KeyDiff**: ~55 → ~50 → ~45.
- **No compression**: Flat at ~60.
#### Vcsum
- **Expected Attention**: ~14 → ~13 → ~12.
- **TOVA**: ~14 → ~13 → ~12.
- **SnapKV**: ~13 → ~12 → ~11.
- **KeyDiff**: ~12 → ~11 → ~10.
- **No compression**: Flat at ~14.
### Key Observations
1. **Compression Effectiveness**: All methods reduce token counts as compression ratio increases, except **No compression** (flat lines).
2. **Performance Hierarchy**:
- **Expected Attention** consistently outperforms other methods in most datasets (e.g., 2Wikimqa, Hotpotqa).
- **KeyDiff** underperforms in datasets like Gov Report and Qmsum.
3. **Dataset Variability**:
- High-token datasets (e.g., Passage Retrieval) show larger absolute reductions.
- Low-token datasets (e.g., Vcsum) have smaller changes.
4. **Anomalies**:
- In Repobch-P, **SnapKV** and **TOVA** perform nearly identically.
- **KeyDiff** shows erratic drops in Hotpotqa and Multi News.
### Interpretation
The data suggests that **Expected Attention** is the most effective compression method across most datasets, significantly reducing token counts while maintaining performance. **KeyDiff** underperforms in several cases, indicating potential inefficiencies in its compression strategy. The **No compression** baseline highlights the trade-off between compression ratio and token retention. Dataset-specific variations imply that method effectiveness may depend on data characteristics (e.g., complexity, size). Further analysis could explore why **KeyDiff** struggles in certain contexts and whether compression ratio thresholds (e.g., 0.5 vs. 0.9) impact outcomes differently.