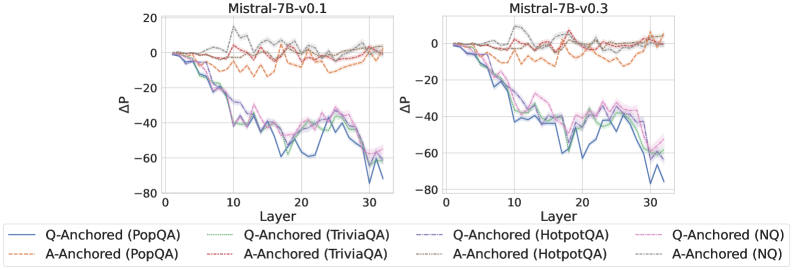
## Line Chart: Performance Comparison of Mistral-7B Models
### Overview
The image presents two line charts comparing the performance of Mistral-7B-v0.1 and Mistral-7B-v0.3 models across different layers and question-answering datasets. The charts display the change in performance (ΔP) as a function of the layer number for various question-answering tasks, anchored by either the question (Q-Anchored) or the answer (A-Anchored).
### Components/Axes
* **Titles:**
* Left Chart: "Mistral-7B-v0.1"
* Right Chart: "Mistral-7B-v0.3"
* **Y-Axis:**
* Label: "ΔP" (Change in Performance)
* Scale: -80 to 20, with increments of 20.
* **X-Axis:**
* Label: "Layer"
* Scale: 0 to 30, with increments of 10.
* **Legend:** Located at the bottom of the image, it identifies the different data series:
* `Q-Anchored (PopQA)`: Solid blue line
* `A-Anchored (PopQA)`: Dashed brown line
* `Q-Anchored (TriviaQA)`: Dotted green line
* `A-Anchored (TriviaQA)`: Dotted-dashed light brown line
* `Q-Anchored (HotpotQA)`: Dashed-dotted dark green line
* `A-Anchored (HotpotQA)`: Solid light green line
* `Q-Anchored (NQ)`: Dotted-dashed pink line
* `A-Anchored (NQ)`: Dotted grey line
### Detailed Analysis
**Left Chart (Mistral-7B-v0.1):**
* **Q-Anchored (PopQA):** (Solid blue line) Starts at approximately 0 and decreases to around -70 by layer 30.
* **A-Anchored (PopQA):** (Dashed brown line) Fluctuates between -10 and 10 across all layers.
* **Q-Anchored (TriviaQA):** (Dotted green line) Starts at approximately 0 and decreases to around -50 by layer 30.
* **A-Anchored (TriviaQA):** (Dotted-dashed light brown line) Fluctuates between -10 and 10 across all layers.
* **Q-Anchored (HotpotQA):** (Dashed-dotted dark green line) Starts at approximately 0 and decreases to around -50 by layer 30.
* **A-Anchored (HotpotQA):** (Solid light green line) Starts at approximately 0 and decreases to around -50 by layer 30.
* **Q-Anchored (NQ):** (Dotted-dashed pink line) Starts at approximately 0 and decreases to around -60 by layer 30.
* **A-Anchored (NQ):** (Dotted grey line) Fluctuates between -10 and 10 across all layers.
**Right Chart (Mistral-7B-v0.3):**
* **Q-Anchored (PopQA):** (Solid blue line) Starts at approximately 0 and decreases to around -70 by layer 30.
* **A-Anchored (PopQA):** (Dashed brown line) Fluctuates between -10 and 10 across all layers.
* **Q-Anchored (TriviaQA):** (Dotted green line) Starts at approximately 0 and decreases to around -50 by layer 30.
* **A-Anchored (TriviaQA):** (Dotted-dashed light brown line) Fluctuates between -10 and 10 across all layers.
* **Q-Anchored (HotpotQA):** (Dashed-dotted dark green line) Starts at approximately 0 and decreases to around -40 by layer 30.
* **A-Anchored (HotpotQA):** (Solid light green line) Starts at approximately 0 and decreases to around -60 by layer 30.
* **Q-Anchored (NQ):** (Dotted-dashed pink line) Starts at approximately 0 and decreases to around -60 by layer 30.
* **A-Anchored (NQ):** (Dotted grey line) Fluctuates between -10 and 10 across all layers.
### Key Observations
* The performance (ΔP) of Q-Anchored tasks (PopQA, TriviaQA, HotpotQA, NQ) generally decreases as the layer number increases for both Mistral-7B-v0.1 and Mistral-7B-v0.3.
* The performance (ΔP) of A-Anchored tasks (PopQA, TriviaQA, HotpotQA, NQ) remains relatively stable across all layers for both models, fluctuating around 0.
* The performance trends are similar between Mistral-7B-v0.1 and Mistral-7B-v0.3.
### Interpretation
The data suggests that as the model processes information through deeper layers, its performance on question-anchored tasks declines. This could indicate that the model is losing relevant information or becoming more prone to errors as it progresses through the layers when the question is the anchor. Conversely, when the answer is the anchor, the model's performance remains relatively stable, suggesting that the answer provides a consistent reference point throughout the processing layers. The similarity in trends between Mistral-7B-v0.1 and Mistral-7B-v0.3 indicates that the underlying architecture and training process have a consistent impact on performance across different versions of the model. The consistent drop in Q-Anchored performance as layers increase may indicate a vanishing gradient or information bottleneck problem.