## Line Charts: Performance Delta (ΔP) Across Model Layers for Two Mistral-7B Versions
### Overview
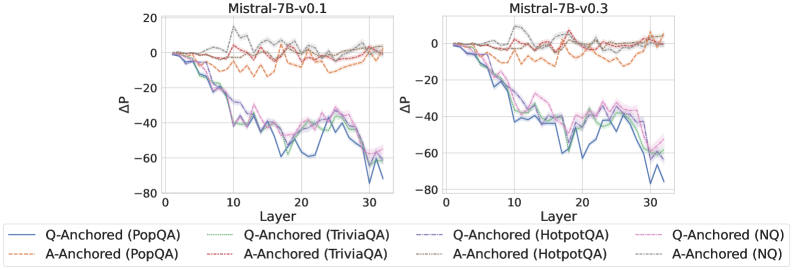
The image displays two side-by-side line charts comparing the performance delta (ΔP) across the 32 layers of two versions of the Mistral-7B language model: "Mistral-7B-v0.1" (left chart) and "Mistral-7B-v0.3" (right chart). Each chart plots the ΔP metric for eight different experimental conditions, which are combinations of an anchoring method (Q-Anchored or A-Anchored) and a dataset (PopQA, TriviaQA, HotpotQA, NQ). The charts illustrate how this performance metric changes as one moves from the model's input layer (Layer 0) to its output layer (Layer 32).
### Components/Axes
* **Chart Titles:** "Mistral-7B-v0.1" (left), "Mistral-7B-v0.3" (right).
* **Y-Axis:** Labeled "ΔP". The scale ranges from -80 to 20, with major tick marks at intervals of 20 (-80, -60, -40, -20, 0, 20).
* **X-Axis:** Labeled "Layer". The scale ranges from 0 to 30, with major tick marks at intervals of 10 (0, 10, 20, 30). The data appears to extend to Layer 32.
* **Legend:** Positioned at the bottom of the image, spanning both charts. It defines eight data series:
1. **Q-Anchored (PopQA):** Solid blue line.
2. **A-Anchored (PopQA):** Dashed orange line.
3. **Q-Anchored (TriviaQA):** Solid green line.
4. **A-Anchored (TriviaQA):** Dashed red line.
5. **Q-Anchored (HotpotQA):** Solid purple line.
6. **A-Anchored (HotpotQA):** Dashed brown line.
7. **Q-Anchored (NQ):** Solid pink line.
8. **A-Anchored (NQ):** Dashed gray line.
### Detailed Analysis
**Trend Verification & Data Points (Approximate Values):**
**Chart 1: Mistral-7B-v0.1**
* **Q-Anchored Series (Solid Lines - Blue, Green, Purple, Pink):** All four lines exhibit a strong, consistent downward trend. They start near ΔP = 0 at Layer 0. By Layer 10, they have dropped to approximately -20 to -40. The decline continues, reaching a trough between Layers 20-30, with values ranging from approximately -40 to -70. There is a slight recovery towards Layer 32, but values remain deeply negative (approx. -50 to -70). The lines are tightly clustered, indicating similar behavior across datasets for the Q-Anchored method.
* **A-Anchored Series (Dashed Lines - Orange, Red, Brown, Gray):** These lines show a markedly different pattern. They fluctuate around the ΔP = 0 baseline across all layers. The values generally stay within a band between -20 and +10. There is no strong directional trend; the lines oscillate, sometimes crossing above and below zero. The orange (PopQA) and red (TriviaQA) lines appear slightly more volatile than the brown (HotpotQA) and gray (NQ) lines.
**Chart 2: Mistral-7B-v0.3**
* **Q-Anchored Series (Solid Lines):** The overall downward trend is present but appears less steep and more erratic compared to v0.1. Starting near 0, the lines drop to around -20 to -40 by Layer 10. The decline continues with significant volatility, hitting lows between -40 and -70 in the Layer 20-30 range. The recovery at the final layers is less pronounced than in v0.1. The clustering of the four lines is slightly looser than in the v0.1 chart.
* **A-Anchored Series (Dashed Lines):** Similar to v0.1, these lines fluctuate around zero. The range of fluctuation appears comparable, mostly between -20 and +10. The behavior is stable across layers without a clear upward or downward trajectory.
### Key Observations
1. **Fundamental Dichotomy:** The most striking observation is the clear separation between the behavior of Q-Anchored methods (solid lines) and A-Anchored methods (dashed lines). This pattern is consistent across both model versions.
2. **Layer-Dependent Degradation for Q-Anchored:** Q-Anchored performance (ΔP) degrades significantly and progressively in the middle to later layers of the model (approx. Layers 10-30).
3. **Stability of A-Anchored:** A-Anchored performance remains relatively stable and close to the baseline (ΔP ≈ 0) throughout the entire depth of the network.
4. **Model Version Comparison:** The general trends are similar between Mistral-7B-v0.1 and v0.3. However, the Q-Anchored degradation in v0.3 appears slightly noisier and the final recovery less clean than in v0.1.
5. **Dataset Similarity:** Within each anchoring method (Q or A), the lines for the four different datasets (PopQA, TriviaQA, HotpotQA, NQ) follow very similar trajectories, suggesting the observed effect is robust across these question-answering benchmarks.
### Interpretation
The data suggests a fundamental difference in how the two anchoring mechanisms interact with the internal representations of the Mistral-7B model across its layers.
* **Q-Anchored (Query-Anchored) methods** appear to rely on information or processing that becomes progressively less effective or more distorted in the deeper, more abstract layers of the network. The large negative ΔP indicates a substantial drop in the measured performance metric. This could imply that the query's representation is not well-preserved or is actively interfered with as it propagates through the transformer blocks.
* **A-Anchored (Answer-Anchored) methods** demonstrate robustness. Their stable ΔP near zero suggests that anchoring to the answer provides a consistent signal or reference point that is maintained throughout the network's depth. This stability might be key to reliable performance.
The **Peircean investigative reading** would focus on the *indexical* relationship: The layer number acts as an index of processing depth. The charts show that the *sign* of Q-Anchored performance (a sharp negative trend) is an index of a specific underlying process (likely representation drift or interference), while the *sign* of A-Anchored performance (stable oscillation) indexes a different, more stable process. The consistency across datasets (PopQA, TriviaQA, etc.) strengthens the claim that this is a model-internal phenomenon, not an artifact of a specific data distribution. The slight differences between v0.1 and v0.3 could indicate architectural or training changes that marginally affect this internal dynamics. The critical takeaway is that the choice of anchoring point (query vs. answer) dictates whether the model's internal processing for this task is layer-sensitive (and degrading) or layer-invariant (and stable).