## Line Chart: ΔP vs Layer for Mistral-7B Model Versions
### Overview
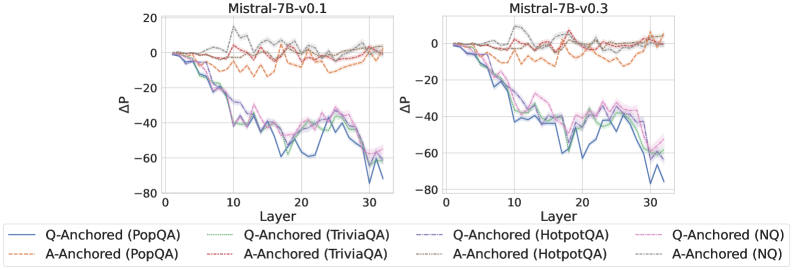
The image contains two side-by-side line charts comparing the performance of different anchoring methods (Q-Anchored and A-Anchored) across model versions (Mistral-7B-v0.1 and Mistral-7B-v0.3). The y-axis represents ΔP (change in performance), and the x-axis represents model layers (0-30). Multiple data series are plotted with distinct line styles and colors.
### Components/Axes
- **X-axis (Layer)**: Labeled "Layer" with ticks at 0, 10, 20, 30. Represents model layers.
- **Y-axis (ΔP)**: Labeled "ΔP" with values ranging from -80 to 20. Represents performance change.
- **Legends**:
- **Left Chart (v0.1)**:
- Solid blue: Q-Anchored (PopQA)
- Dashed red: A-Anchored (PopQA)
- Dotted green: Q-Anchored (TriviaQA)
- Dash-dot pink: A-Anchored (TriviaQA)
- **Right Chart (v0.3)**:
- Solid blue: Q-Anchored (HotpotQA)
- Dashed red: A-Anchored (HotpotQA)
- Dotted green: Q-Anchored (NQ)
- Dash-dot pink: A-Anchored (NQ)
### Detailed Analysis
#### Left Chart (Mistral-7B-v0.1)
1. **Q-Anchored (PopQA)** (solid blue):
- Starts at ΔP ≈ 0 at layer 0.
- Sharp decline to ΔP ≈ -60 at layer 10.
- Fluctuates between -40 and -20 until layer 30.
2. **A-Anchored (PopQA)** (dashed red):
- Starts at ΔP ≈ 0.
- Gradual decline to ΔP ≈ -20 at layer 10.
- Stabilizes near ΔP ≈ -10 by layer 30.
3. **Q-Anchored (TriviaQA)** (dotted green):
- Starts at ΔP ≈ 0.
- Sharp drop to ΔP ≈ -50 at layer 10.
- Recovers slightly to ΔP ≈ -30 by layer 30.
4. **A-Anchored (TriviaQA)** (dash-dot pink):
- Starts at ΔP ≈ 0.
- Gradual decline to ΔP ≈ -15 at layer 10.
- Stabilizes near ΔP ≈ -5 by layer 30.
#### Right Chart (Mistral-7B-v0.3)
1. **Q-Anchored (HotpotQA)** (solid blue):
- Starts at ΔP ≈ 0.
- Sharp drop to ΔP ≈ -50 at layer 10.
- Recovers to ΔP ≈ -20 by layer 30.
2. **A-Anchored (HotpotQA)** (dashed red):
- Starts at ΔP ≈ 0.
- Gradual decline to ΔP ≈ -10 at layer 10.
- Stabilizes near ΔP ≈ -5 by layer 30.
3. **Q-Anchored (NQ)** (dotted green):
- Starts at ΔP ≈ 0.
- Sharp drop to ΔP ≈ -70 at layer 10.
- Recovers to ΔP ≈ -40 by layer 30.
4. **A-Anchored (NQ)** (dash-dot pink):
- Starts at ΔP ≈ 0.
- Gradual decline to ΔP ≈ -15 at layer 10.
- Stabilizes near ΔP ≈ -5 by layer 30.
### Key Observations
1. **Version Differences**:
- v0.1 shows more pronounced fluctuations in ΔP compared to v0.3.
- v0.3 demonstrates greater stability in performance across layers.
2. **Anchoring Method Trends**:
- Q-Anchored methods consistently show sharper initial drops in ΔP.
- A-Anchored methods exhibit smoother, more gradual declines.
3. **Dataset-Specific Behavior**:
- NQ dataset in v0.3 shows the most extreme ΔP drop (-70 at layer 10).
- PopQA in v0.1 has the least severe initial drop (-60 at layer 10).
### Interpretation
The data suggests that anchoring methods significantly impact model performance across layers, with Q-Anchored approaches causing more abrupt performance changes. Version v0.3 shows improved stability compared to v0.1, particularly for the NQ dataset. The A-Anchored methods appear more robust to layer-specific variations, maintaining closer-to-zero ΔP values throughout the model. The extreme drop in Q-Anchored (NQ) for v0.3 highlights potential dataset-specific vulnerabilities in the anchoring strategy.