# Technical Document Extraction: AI Model Performance and Scaling Analysis
This document provides a comprehensive extraction of data and conceptual diagrams from the provided image, which analyzes the relationship between model accuracy, task length, scaling, and self-conditioning in Large Language Models (LLMs).
---
## 1. Top Left Panel: Diminishing Gains vs. Exponential Gains
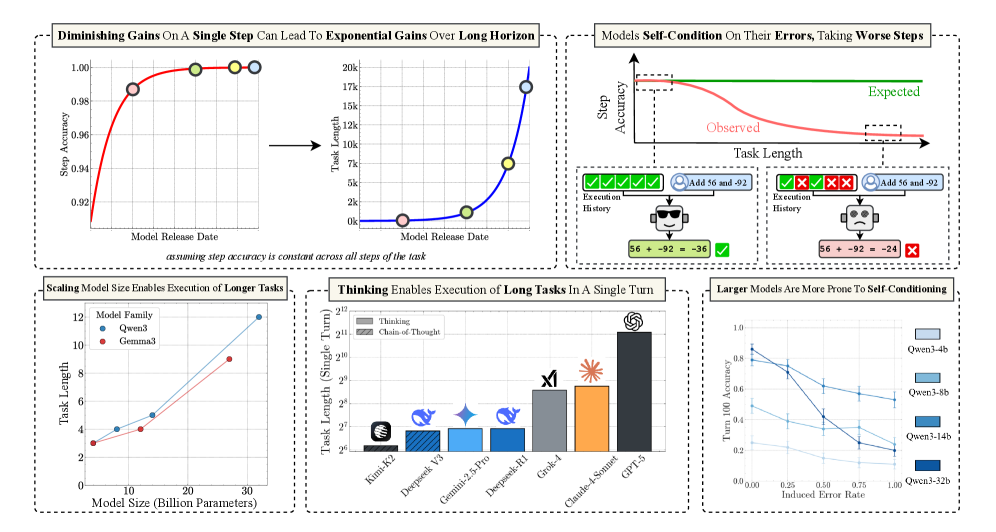
**Header:** Diminishing Gains On A Single Step Can Lead To Exponential Gains Over Long Horizon
**Sub-caption:** *assuming step accuracy is constant across all steps of the task*
### Chart A: Step Accuracy vs. Model Release Date
* **Y-Axis:** Step Accuracy (Range: 0.92 to 1.00)
* **X-Axis:** Model Release Date (Time progression)
* **Trend:** A red logarithmic curve showing rapid initial improvement that plateaus as it approaches 1.00 (100% accuracy).
* **Data Points (Color-coded markers):**
* **Pink:** ~0.987 accuracy.
* **Green:** ~0.998 accuracy.
* **Yellow:** ~0.999 accuracy.
* **Light Blue:** ~1.000 accuracy.
### Chart B: Task Length vs. Model Release Date
* **Y-Axis:** Task Length (Linear scale: 0k to 20k)
* **X-Axis:** Model Release Date
* **Trend:** A blue exponential curve. While step accuracy (Chart A) shows diminishing returns, the resulting maximum task length achievable grows exponentially.
* **Data Points (Mapped from Chart A):**
* **Pink:** ~0.5k task length.
* **Green:** ~1.5k task length.
* **Yellow:** ~7.5k task length.
* **Light Blue:** ~17.5k task length.
---
## 2. Top Right Panel: Self-Conditioning and Error Propagation
**Header:** Models Self-Condition On Their Errors, Taking Worse Steps
### Conceptual Chart: Step Accuracy vs. Task Length
* **Y-Axis:** Step Accuracy
* **X-Axis:** Task Length
* **Series 1 (Green Line):** "Expected" - A horizontal line representing constant accuracy.
* **Series 2 (Red Line):** "Observed" - A downward sloping curve showing that as task length increases, step accuracy degrades.
### Diagram: Execution History Comparison
* **Left Scenario (Success):**
* **Execution History:** Five green checkmarks.
* **Input:** User icon + "Add 56 and -92".
* **Model State:** Smiling robot icon.
* **Output:** `56 + -92 = -36` [Green Checkmark].
* **Right Scenario (Failure due to Self-Conditioning):**
* **Execution History:** Two green checkmarks followed by three red "X" marks.
* **Input:** User icon + "Add 56 and -92".
* **Model State:** Sad/Confused robot icon.
* **Output:** `56 + -92 = -24` [Red X].
* **Logic:** The diagram illustrates that previous errors in the history cause the model to perform worse on subsequent steps.
---
## 3. Bottom Left Panel: Scaling and Task Length
**Header:** Scaling Model Size Enables Execution of Longer Tasks
| Model Family | Parameter Count (Billion) | Task Length (Approx.) |
| :--- | :--- | :--- |
| Gemma3 (Red) | 2 | 3 |
| Gemma3 (Red) | 12 | 4 |
| Gemma3 (Red) | 27 | 9 |
| Qwen3 (Blue) | 8 | 4 |
| Qwen3 (Blue) | 14 | 5 |
| Qwen3 (Blue) | 32 | 12 |
* **Trends:** Both model families show a positive linear correlation between parameter count and task length.
---
## 4. Bottom Middle Panel: Thinking and Long Tasks
**Header:** Thinking Enables Execution of Long Tasks In A Single Turn
* **Y-Axis:** Task Length (Single Turn) - Logarithmic Scale ($2^6$ to $2^{12}$)
* **Legend:**
* **Solid Grey:** Thinking
* **Hatched Grey:** Chain-of-Thought
| Model | Task Length (Log Scale) | Visual Style |
| :--- | :--- | :--- |
| Kimi-K2 | ~$2^{6.2}$ | Solid Grey |
| Deepseek V3 | ~$2^{6.8}$ | Hatched Blue |
| Gemini-2.5-Pro | ~$2^{6.9}$ | Solid Light Blue |
| Deepseek-R1 | ~$2^{6.9}$ | Solid Blue |
| Grok-4 | ~$2^{8.5}$ | Solid Grey |
| Claude-4-Sonnet | ~$2^{8.8}$ | Solid Orange |
| GPT-5 | ~$2^{11.1}$ | Solid Dark Grey |
---
## 5. Bottom Right Panel: Self-Conditioning Sensitivity
**Header:** Larger Models Are More Prone To Self-Conditioning
* **Y-Axis:** Turn 100 Accuracy (Scale: 0.0 to 1.0)
* **X-Axis:** Induced Error Rate (Scale: 0.00 to 1.00)
* **Trend Verification:** All lines slope downward. As the induced error rate increases, the accuracy at turn 100 drops.
* **Key Observation:** The largest model (Qwen3-32b) starts with the highest accuracy at 0.00 error rate (~0.85) but has the steepest decline, indicating higher sensitivity to previous errors.
| Model | Accuracy at 0.00 Induced Error | Accuracy at 1.00 Induced Error |
| :--- | :--- | :--- |
| Qwen3-32b (Darkest Blue) | 0.85 | 0.20 |
| Qwen3-14b (Medium Blue) | 0.80 | 0.25 |
| Qwen3-8b (Light Blue) | 0.50 | 0.10 |
| Qwen3-4b (Lightest Blue) | 0.25 | 0.05 |