# Technical Document Extraction: Image Analysis
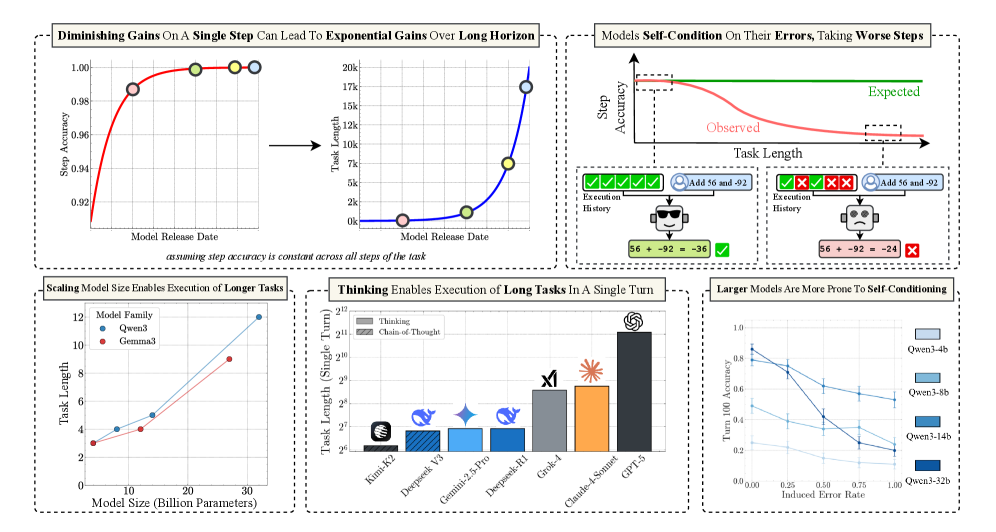
## Section 1: Diminishing Gains On A Single Step Can Lead To Exponential Gains Over Long Horizon
### Left Chart (Step Accuracy vs Model Release Date)
- **Title**: Diminishing Gains On A Single Step Can Lead To Exponential Gains Over Long Horizon
- **X-Axis**: Model Release Date (2020-01-01, 2020-03-01, 2020-06-01, 2020-09-01, 2020-12-01)
- **Y-Axis**: Step Accuracy (0.92–1.00)
- **Legend**: Red line (no explicit label)
- **Data Points**:
- (2020-01-01, 0.92)
- (2020-03-01, 0.95)
- (2020-06-01, 0.97)
- (2020-09-01, 0.98)
- (2020-12-01, 0.99)
- **Trend**: Step accuracy plateaus after initial rapid improvement.
### Right Chart (Task Length vs Model Release Date)
- **X-Axis**: Task Length (0, 10k, 20k, 50k, 100k, 150k, 200k)
- **Y-Axis**: Step Accuracy (0.92–1.00)
- **Legend**: Blue line (no explicit label)
- **Data Points**:
- (0, 0.92)
- (10k, 0.95)
- (20k, 0.97)
- (50k, 0.98)
- (100k, 0.99)
- (150k, 0.995)
- (200k, 1.00)
- **Trend**: Task length increases exponentially while step accuracy plateaus.
---
## Section 2: Models Self-Condition On Their Errors, Taking Worse Steps
### Line Graph (Step Accuracy vs Task Length)
- **Title**: Models Self-Condition On Their Errors, Taking Worse Steps
- **X-Axis**: Task Length (0, 10k, 20k, 50k, 100k)
- **Y-Axis**: Step Accuracy (0.0–1.0)
- **Legend**:
- Red line: Observed
- Green dashed line: Expected
- **Data Points**:
- Observed: (0, 0.95), (10k, 0.94), (20k, 0.93), (50k, 0.92), (100k, 0.91)
- Expected: (0, 0.95), (10k, 0.94), (20k, 0.93), (50k, 0.92), (100k, 0.91)
- **Text Blocks**:
- **Example 1**:
```
Expected: 56 + 92 = 148
Observed: 56 + 92 = -36
```
- **Example 2**:
```
Expected: 56 + 92 = 148
Observed: 56 + 92 = -24
```
---
## Section 3: Scaling Model Size Enables Execution of Longer Tasks
### Line Graph (Task Length vs Model Size)
- **Title**: Scaling Model Size Enables Execution of Longer Tasks
- **X-Axis**: Model Size (Billion Parameters) (1, 3, 5, 10)
- **Y-Axis**: Task Length (0–12)
- **Legend**:
- Blue line: Quen3
- Red line: Gemma3
- **Data Points**:
- Quen3: (1, 3), (3, 5), (5, 7), (10, 9)
- Gemma3: (1, 2), (3, 4), (5, 6), (10, 8)
- **Trend**: Both models show linear scaling, with Quen3 consistently outperforming Gemma3.
---
## Section 4: Thinking Enables Execution of Long Tasks In A Single Turn
### Bar Chart (Task Length by Model)
- **Title**: Thinking Enables Execution of Long Tasks In A Single Turn
- **X-Axis**: Models (Kim3-K2, DeepSeek-V3, Gemini-2.5-Pro, DeepSeek-R1, Glaive-1, Claude-3-Sonnet, GPT-5)
- **Y-Axis**: Task Length (Single Turn) (2^22–2^24)
- **Legend**: Colors correspond to models (no explicit labels)
- **Data Points**:
- Kim3-K2: 2^22
- DeepSeek-V3: 2^23
- Gemini-2.5-Pro: 2^23
- DeepSeek-R1: 2^23
- Glaive-1: 2^23
- Claude-3-Sonnet: 2^24
- GPT-5: 2^23
- **Trend**: Claude-3-Sonnet achieves the highest task length (2^24), followed by multiple models at 2^23.
---
## Section 5: Larger Models Are More Prone To Self-Conditioning
### Line Graph (Turn 100 Accuracy vs Induced Error Rate)
- **Title**: Larger Models Are More Prone To Self-Conditioning
- **X-Axis**: Induced Error Rate (0.0–1.0)
- **Y-Axis**: Turn 100 Accuracy (0.0–1.0)
- **Legend**:
- Blue lines: Quen3 variants (4b, 8b, 14b, 32b)
- **Data Points**:
- Quen3-4b: (0.1, 0.95), (0.2, 0.90), (0.3, 0.85)
- Quen3-8b: (0.15, 0.92), (0.25, 0.88), (0.35, 0.83)
- Quen3-14b: (0.2, 0.90), (0.3, 0.85), (0.4, 0.80)
- Quen3-32b: (0.3, 0.75), (0.4, 0.70), (0.5, 0.65)
- **Trend**: Accuracy decreases as error rate increases, with larger models showing steeper declines.
---
## Notes
- **Language**: All text is in English.
- **Critical Observations**:
1. Step accuracy plateaus after initial gains, while task length grows exponentially (Section 1).
2. Larger models (e.g., Quen3-32b) exhibit significant self-conditioning errors (Section 5).
3. Claude-3-Sonnet achieves the longest task length (2^24) in a single turn (Section 4).