## Chart/Diagram Type: Receiver Operating Characteristic (ROC) Curve
### Overview
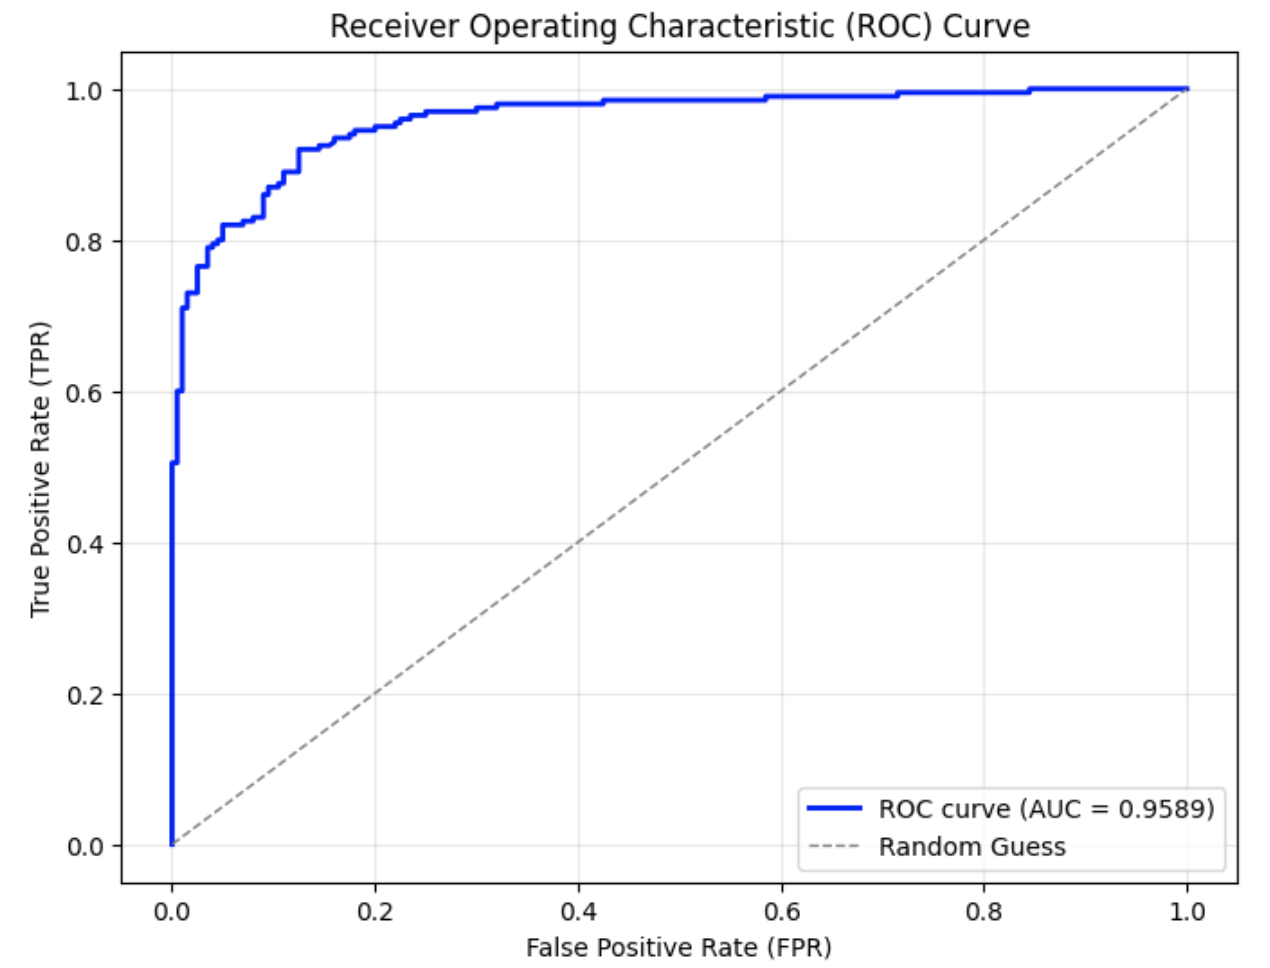
The image depicts a Receiver Operating Characteristic (ROC) curve, a graphical plot illustrating the diagnostic ability of a binary classifier system. The curve demonstrates the trade-off between the True Positive Rate (TPR) and the False Positive Rate (FPR) at various threshold settings. A high Area Under the Curve (AUC) value indicates superior model performance.
### Components/Axes
- **X-Axis**: Labeled "False Positive Rate (FPR)" with markers at 0.0, 0.2, 0.4, 0.6, 0.8, and 1.0.
- **Y-Axis**: Labeled "True Positive Rate (TPR)" with markers at 0.0, 0.2, 0.4, 0.6, 0.8, and 1.0.
- **Legend**: Located in the bottom-right corner, containing:
- **Blue Solid Line**: "ROC curve (AUC = 0.9589)"
- **Gray Dashed Line**: "Random Guess"
### Detailed Analysis
- **ROC Curve (Blue Solid Line)**:
- Begins at (0.0, 0.0) and rises sharply to approximately (0.1, 1.0), indicating near-perfect TPR at low FPR.
- Plateaus near TPR = 1.0 as FPR increases from 0.1 to 1.0, suggesting minimal degradation in performance despite rising false positives.
- Ends at (1.0, 1.0), aligning with the random guess line at the upper-right corner.
- **Random Guess Line (Gray Dashed Line)**:
- A diagonal line from (0.0, 0.0) to (1.0, 1.0), representing a classifier with no discriminative ability (AUC = 0.5).
### Key Observations
1. The ROC curve dominates the random guess line, confirming the model’s high discriminative power.
2. The steep initial ascent highlights exceptional sensitivity at low FPR, ideal for applications requiring high precision.
3. The plateau at TPR ≈ 1.0 indicates robustness against increasing FPR, maintaining high recall.
4. AUC = 0.9589 (95.89%) signifies near-optimal performance, with only 4.11% of the classification space unaccounted for.
### Interpretation
The ROC curve demonstrates that the classifier is highly effective at distinguishing between classes, with minimal false positives at critical thresholds. The AUC value of 0.9589 suggests the model is suitable for high-stakes applications (e.g., medical diagnostics, fraud detection) where balancing false positives and true positives is critical. The plateau at high TPR implies the classifier maintains reliability even as thresholds are relaxed, though this may come at the cost of increased false alarms in later stages. The sharp rise at low FPR underscores its utility in scenarios prioritizing precision over recall.