## Chart Type: Receiver Operating Characteristic (ROC) Curve
### Overview
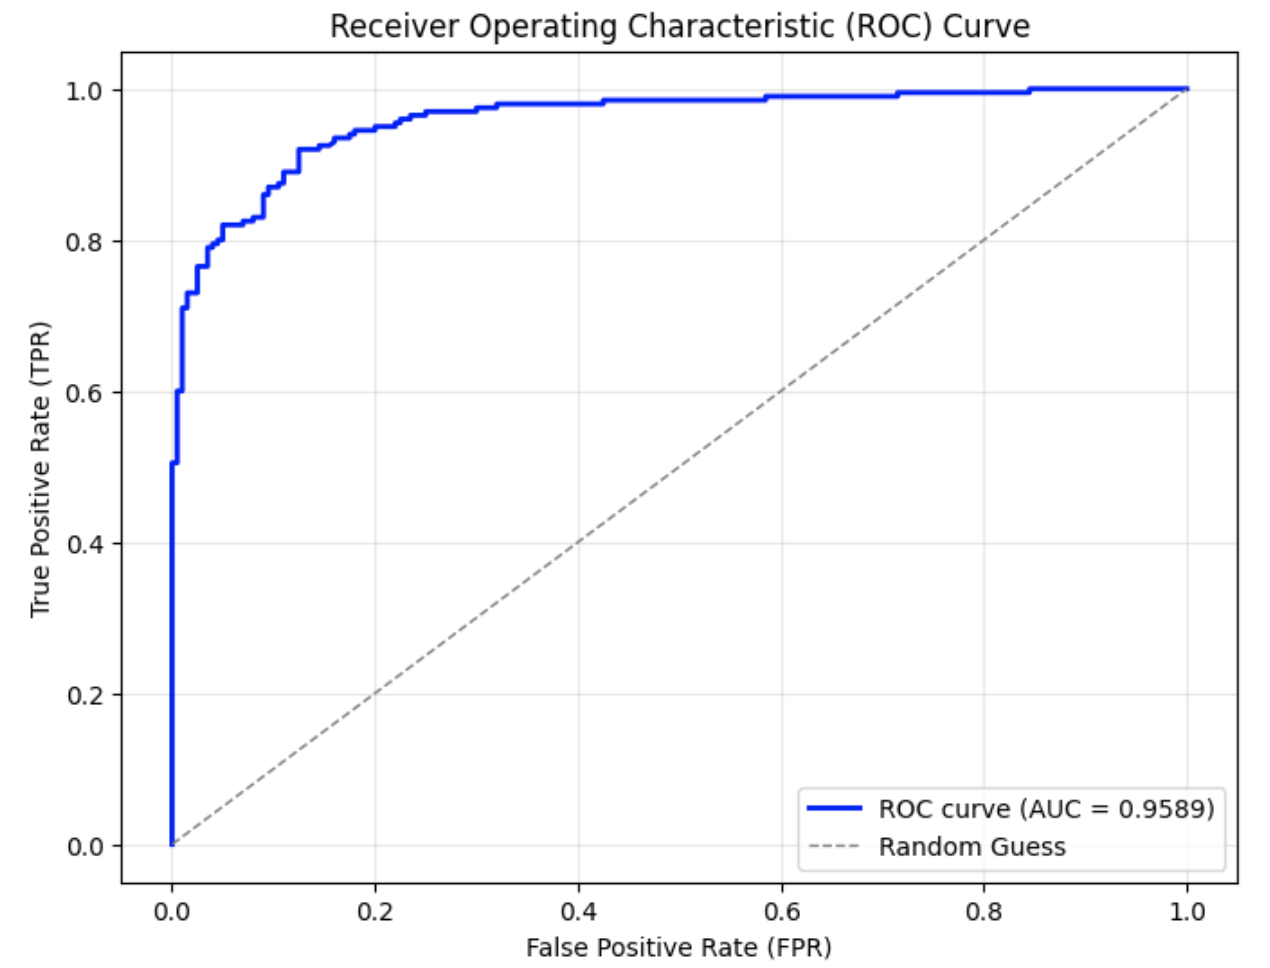
The image is a Receiver Operating Characteristic (ROC) curve, which plots the True Positive Rate (TPR) against the False Positive Rate (FPR). It shows the performance of a classification model at all classification thresholds. The plot includes the ROC curve itself, a dashed line representing a random guess, and the Area Under the Curve (AUC) value for the ROC curve.
### Components/Axes
* **Title:** Receiver Operating Characteristic (ROC) Curve
* **X-axis:** False Positive Rate (FPR), ranging from 0.0 to 1.0 in increments of 0.2.
* **Y-axis:** True Positive Rate (TPR), ranging from 0.0 to 1.0 in increments of 0.2.
* **Grid:** Light gray grid lines are present at each 0.2 increment on both axes.
* **Legend:** Located in the bottom-right corner:
* Blue solid line: ROC curve (AUC = 0.9589)
* Gray dashed line: Random Guess
### Detailed Analysis
* **ROC Curve (Blue):** The blue line represents the ROC curve. It starts at (0.0, 0.0) and rises sharply to a TPR of approximately 0.7 at an FPR of around 0.02. It then continues to rise, but at a slower rate, reaching a TPR of approximately 0.95 at an FPR of around 0.2. From there, it gradually approaches a TPR of 1.0 as the FPR increases to 1.0. The AUC is given as 0.9589.
* **Random Guess (Gray Dashed):** The gray dashed line represents a random guess. It is a diagonal line from (0.0, 0.0) to (1.0, 1.0).
* **Data Points:**
* (0.0, 0.0) - Starting point of both curves.
* (0.02, 0.7) - Approximate point on the ROC curve where it rises sharply.
* (0.2, 0.95) - Approximate point on the ROC curve where it starts to flatten.
* (1.0, 1.0) - Ending point of both curves.
### Key Observations
* The ROC curve is significantly above the random guess line, indicating a good classification model.
* The AUC value of 0.9589 is close to 1.0, which suggests excellent performance.
* The steep initial rise of the ROC curve indicates that the model can achieve a high true positive rate with a very low false positive rate.
### Interpretation
The ROC curve and the associated AUC value demonstrate that the classification model performs very well. The model is able to distinguish between positive and negative cases with high accuracy. The large area under the curve indicates that the model is robust and can maintain its performance across different classification thresholds. The model is significantly better than random guessing, making it a useful tool for classification tasks.