# Technical Document Extraction: Revision Model Performance Analysis
## Chart 1: Revision Model Pass@1 At Each Step
### Axes and Labels
- **X-axis**: "Number of Generations" (Range: 0–60)
- **Y-axis**: "MATH Test Accuracy (%)" (Range: 17%–26%)
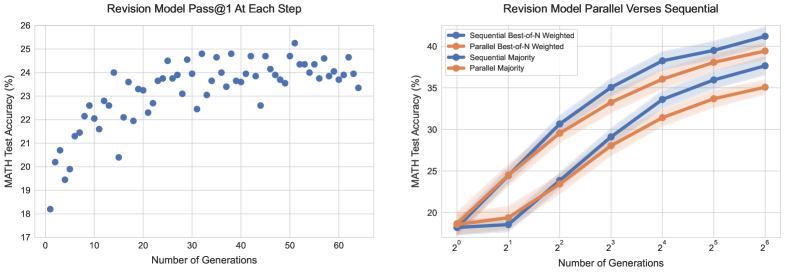
- **Title**: "Revision Model Pass@1 At Each Step"
### Data Trends
- **Visual Pattern**: Scattered blue data points with no explicit line connecting them.
- **Key Observations**:
- Initial accuracy starts at ~18% (x=0).
- Gradual increase to ~24% by x=30 generations.
- Plateau observed between x=30–60 generations, with accuracy fluctuating between 23%–25%.
- No clear upward/downward trend after x=30; data points cluster tightly around 24%.
### Spatial Grounding
- Legend: Not applicable (no legend present).
---
## Chart 2: Revision Model Parallel Verses Sequential
### Axes and Labels
- **X-axis**: "Number of Generations" (Categorical: 2⁰, 2¹, 2², 2³, 2⁴, 2⁵, 2⁶)
- **Y-axis**: "MATH Test Accuracy (%)" (Range: 17%–40%)
- **Title**: "Revision Model Parallel Verses Sequential"
### Legend
- **Location**: Upper-right corner.
- **Entries**:
1. **Sequential Best-of-N Weighted**: Blue line with diamond markers.
2. **Parallel Best-of-N Weighted**: Orange line with square markers.
3. **Sequential Majority**: Blue line with circle markers.
4. **Parallel Majority**: Orange line with triangle markers.
### Data Trends
1. **Sequential Best-of-N Weighted**:
- **Trend**: Steady upward slope from ~18% (2⁰) to ~42% (2⁶).
- **Key Points**:
- 2⁰: 18%
- 2¹: 22%
- 2²: 31%
- 2³: 36%
- 2⁴: 38%
- 2⁵: 40%
- 2⁶: 42%
2. **Parallel Best-of-N Weighted**:
- **Trend**: Gradual upward slope from ~18% (2⁰) to ~39% (2⁶).
- **Key Points**:
- 2⁰: 18%
- 2¹: 24%
- 2²: 30%
- 2³: 34%
- 2⁴: 36%
- 2⁵: 38%
- 2⁶: 39%
3. **Sequential Majority**:
- **Trend**: Steep upward slope from ~18% (2⁰) to ~38% (2⁶).
- **Key Points**:
- 2⁰: 18%
- 2¹: 20%
- 2²: 24%
- 2³: 29%
- 2⁴: 33%
- 2⁵: 36%
- 2⁶: 38%
4. **Parallel Majority**:
- **Trend**: Moderate upward slope from ~18% (2⁰) to ~36% (2⁶).
- **Key Points**:
- 2⁰: 18%
- 2¹: 22%
- 2²: 27%
- 2³: 31%
- 2⁴: 33%
- 2⁵: 35%
- 2⁶: 36%
### Spatial Grounding
- Legend: Upper-right corner (confirmed via visual alignment with line colors).
### Cross-Reference Verification
- **Color Consistency**:
- Blue lines correspond to "Sequential" methods (Best-of-N and Majority).
- Orange lines correspond to "Parallel" methods (Best-of-N and Majority).
- Marker shapes (diamond, square, circle, triangle) match legend entries.
### Component Isolation
1. **Header**: Titles for both charts.
2. **Main Charts**:
- Left: Scatter plot with plateau trend.
- Right: Line chart with four distinct data series.
3. **Footer**: No footer present.
---
## Summary of Findings
1. **Chart 1** demonstrates a stabilization of model performance after ~30 generations, with accuracy plateauing near 24%.
2. **Chart 2** highlights performance divergence between parallel and sequential methods:
- **Sequential Best-of-N** achieves the highest accuracy (~42% at 2⁶ generations).
- **Parallel Best-of-N** underperforms sequential methods but outperforms parallel majority.
- **Sequential Majority** shows rapid improvement but lags behind Best-of-N variants.
- **Parallel Majority** exhibits the slowest growth among the four methods.