## Line Chart: Cost per Query Comparison
### Overview
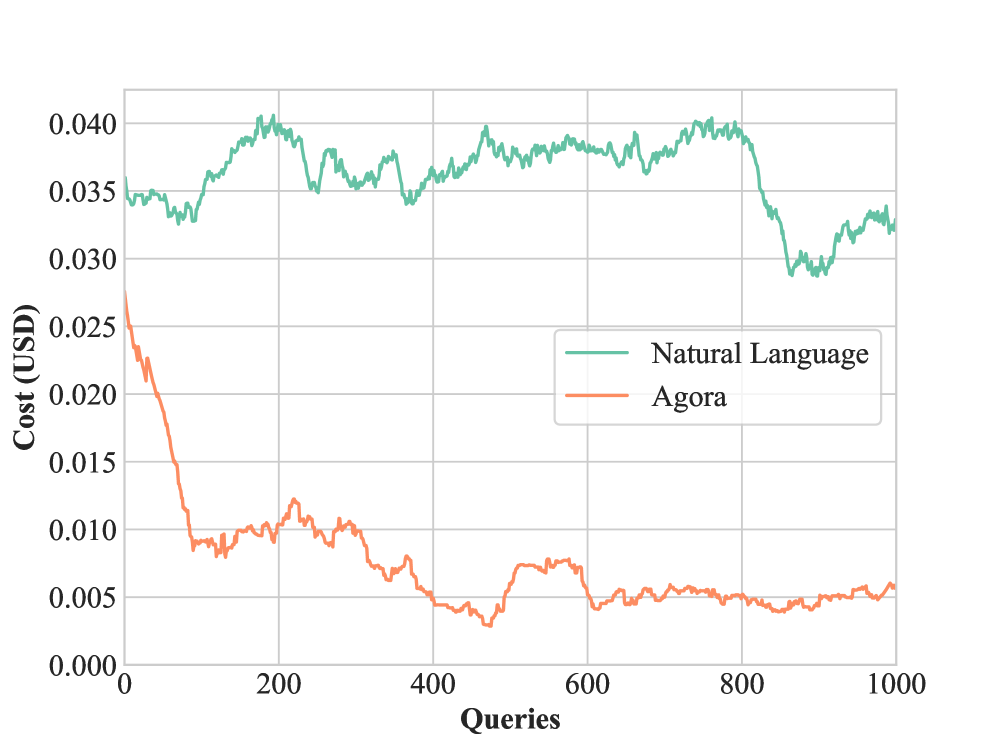
The image displays a line chart comparing the cost in US Dollars (USD) of two methods, "Natural Language" and "Agora," over a sequence of 1000 queries. The chart illustrates how the cost per query evolves for each method as the number of queries increases.
### Components/Axes
* **Chart Type:** Line chart with two data series.
* **X-Axis:**
* **Label:** "Queries"
* **Scale:** Linear, from 0 to 1000.
* **Major Tick Marks:** 0, 200, 400, 600, 800, 1000.
* **Y-Axis:**
* **Label:** "Cost (USD)"
* **Scale:** Linear, from 0.000 to 0.040.
* **Major Tick Marks:** 0.000, 0.005, 0.010, 0.015, 0.020, 0.025, 0.030, 0.035, 0.040.
* **Legend:**
* **Position:** Center-right of the plot area.
* **Entries:**
1. **Natural Language:** Represented by a teal/green line.
2. **Agora:** Represented by an orange line.
### Detailed Analysis
**1. Natural Language (Teal Line):**
* **Trend:** The line exhibits high-frequency fluctuations but maintains a generally high and relatively stable cost band throughout the 1000 queries.
* **Data Points (Approximate):**
* Starts at ~0.035 USD at query 0.
* Peaks near ~0.040 USD around query 200.
* Fluctuates primarily between ~0.033 and ~0.040 USD for most of the range.
* Shows a notable decline after query 800, dropping to a local minimum of ~0.029 USD around query 850.
* Recovers slightly to end at ~0.033 USD at query 1000.
**2. Agora (Orange Line):**
* **Trend:** The line shows a steep initial decline followed by stabilization at a much lower cost level.
* **Data Points (Approximate):**
* Starts at its highest point of ~0.027 USD at query 0.
* Experiences a rapid, near-linear decrease, falling below 0.010 USD by approximately query 100.
* Reaches a local minimum of ~0.003 USD around query 450.
* After query 400, the cost stabilizes and fluctuates within a narrow band between ~0.004 and ~0.008 USD for the remainder of the chart.
* Ends at approximately 0.006 USD at query 1000.
### Key Observations
* **Cost Differential:** The Agora method becomes significantly cheaper than the Natural Language method after the initial ~50 queries and maintains a large cost advantage thereafter.
* **Stability vs. Decline:** The Natural Language cost is volatile but range-bound. The Agora cost shows a clear learning or optimization curve, with cost decreasing dramatically before plateauing.
* **Notable Event:** Both lines show a dip around query 800-850, though the dip is more pronounced in the Natural Language series.
* **No Intersection:** After the very first few data points, the two lines do not cross, indicating a consistent cost relationship after the initial phase.
### Interpretation
The data strongly suggests that the "Agora" system achieves substantial cost efficiency gains as it processes more queries, likely due to an optimization, caching, or learning mechanism. Its cost profile is characteristic of a system with high initial overhead that amortizes quickly. In contrast, the "Natural Language" method appears to have a consistently higher operational cost per query, with variability that may reflect the inherent complexity or lack of standardization in processing unstructured natural language inputs.
The chart demonstrates a clear economic advantage for the Agora approach in scenarios involving high query volumes. The initial higher cost of Agora is quickly offset, making it the more cost-effective solution for sustained use. The parallel dip around query 800 might indicate an external factor affecting both systems, such as a change in query complexity or a system-wide event, but the Agora system's lower baseline makes it less affected in absolute terms.