## Line Graphs: Training/Test Loss and Local Learning Coefficient vs. Iteration
### Overview
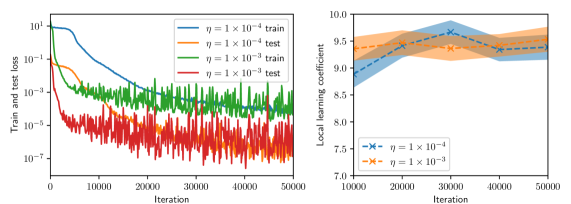
The image contains two side-by-side line graphs. The left graph compares training and test loss across iterations for two learning rates (η = 1×10⁻⁴ and η = 1×10⁻³). The right graph shows the local learning coefficient over iterations for the same learning rates, with shaded confidence intervals.
---
### Components/Axes
#### Left Graph (Train/Test Loss)
- **X-axis**: Iteration (0 to 50,000, linear scale)
- **Y-axis**: Train and test loss (logarithmic scale, 10⁻⁷ to 10¹)
- **Legend**:
- Blue: η = 1×10⁻⁴ (train)
- Orange: η = 1×10⁻⁴ (test)
- Green: η = 1×10⁻³ (train)
- Red: η = 1×10⁻³ (test)
- **Legend Position**: Top-right corner
#### Right Graph (Local Learning Coefficient)
- **X-axis**: Iteration (0 to 50,000, linear scale)
- **Y-axis**: Local learning coefficient (linear scale, 7.0 to 10.0)
- **Legend**:
- Blue: η = 1×10⁻⁴
- Orange: η = 1×10⁻³
- **Legend Position**: Top-right corner
- **Shaded Regions**: Confidence intervals (blue: narrow, orange: wide)
---
### Detailed Analysis
#### Left Graph (Train/Test Loss)
1. **Training Loss**:
- **η = 1×10⁻⁴ (blue)**: Starts at ~10¹, drops sharply to ~10⁻⁵ by 10,000 iterations, then stabilizes with minor fluctuations.
- **η = 1×10⁻³ (green)**: Starts at ~10⁻¹, decreases to ~10⁻⁵ by 20,000 iterations, then fluctuates around 10⁻⁵–10⁻⁴.
2. **Test Loss**:
- **η = 1×10⁻⁴ (orange)**: Starts at ~10⁻¹, decreases to ~10⁻³ by 10,000 iterations, then stabilizes with minor noise.
- **η = 1×10⁻³ (red)**: Starts at ~10⁻², decreases to ~10⁻⁴ by 20,000 iterations, then exhibits high volatility (spikes to 10⁻²).
#### Right Graph (Local Learning Coefficient)
- **η = 1×10⁻⁴ (blue)**: Starts at ~8.5, rises to ~9.5 by 20,000 iterations, then stabilizes with minor fluctuations (~9.0–9.5).
- **η = 1×10⁻³ (orange)**: Starts at ~8.0, rises to ~9.0 by 20,000 iterations, then stabilizes with wider fluctuations (~8.5–9.5).
- **Confidence Intervals**:
- Blue (η = 1×10⁻⁴): Narrow (~±0.2)
- Orange (η = 1×10⁻³): Wide (~±0.5)
---
### Key Observations
1. **Training/Test Loss**:
- Lower η (1×10⁻⁴) achieves faster and more stable convergence for both training and test loss.
- Higher η (1×10⁻³) shows slower convergence and significant test loss volatility, suggesting potential overfitting or instability.
2. **Local Learning Coefficient**:
- Both η values stabilize around 9.0–9.5 after 20,000 iterations.
- Higher η (1×10⁻³) exhibits greater uncertainty (wider confidence interval), indicating less reliable learning dynamics.
---
### Interpretation
- **Learning Rate Impact**:
- η = 1×10⁻⁴ demonstrates superior performance in terms of faster convergence, lower loss, and stable learning dynamics.
- η = 1×10⁻³ introduces instability, as evidenced by test loss spikes and wider confidence intervals in the learning coefficient.
- **Test Loss Volatility**: The red line (η = 1×10⁻³ test) suggests the model may be overfitting or sensitive to noise at higher learning rates.
- **Confidence Intervals**: The right graph highlights that η = 1×10⁻³ has less predictable learning behavior, which could hinder reliable model training.
This analysis underscores the trade-off between learning rate magnitude and model stability, with lower η favoring robustness and higher η risking erratic performance.