## Screenshot: Financial Document Page (FIS/2016/page_45.pdf-3)
### Overview
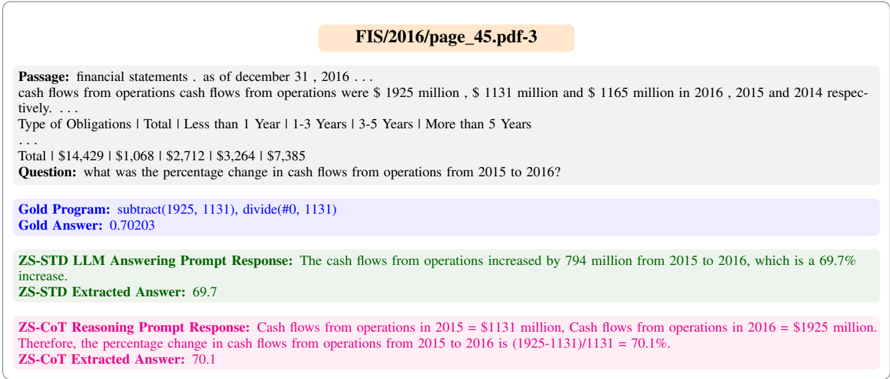
The image is a screenshot of a financial document page detailing cash flow data and obligations. It includes numerical values, a question about percentage change in cash flows, and conflicting answers from automated systems.
### Components/Axes
- **Title**: "FIS/2016/page_45.pdf-3" (document identifier).
- **Passage Text**:
- Financial statements as of December 31, 2016.
- Cash flows from operations:
- 2016: $1,925 million
- 2015: $1,131 million
- 2014: $1,165 million
- **Table**:
- **Type of Obligations**: Total, Less than 1 Year, 1-3 Years, 3-5 Years, More than 5 Years.
- **Values**:
- Total: $14,429 million
- Less than 1 Year: $1,068 million
- 1-3 Years: $2,712 million
- 3-5 Years: $3,264 million
- More than 5 Years: $7,385 million
- **Question**: "What was the percentage change in cash flows from operations from 2015 to 2016?"
- **Automated Answers**:
- **Gold Program**: `subtract(1925, 1131), divide(#0, 1131)` → **70.203%**
- **ZS-STD LLM Answering Prompt**: "69.7% increase" (cash flows increased by $794 million).
- **ZS-CoT Reasoning Prompt**: "70.1%" (calculated as `(1925-1131)/1131`).
### Detailed Analysis
- **Cash Flow Values**:
- 2016: $1,925 million (highlighted in the passage).
- 2015: $1,131 million (base year for comparison).
- 2014: $1,165 million (prior year for context).
- **Obligations Table**:
- Total obligations: $14,429 million.
- Breakdown by maturity:
- Short-term (<1 year): $1,068 million.
- Medium-term (1-3 years): $2,712 million.
- Long-term (3-5 years): $3,264 million.
- Very long-term (>5 years): $7,385 million.
- **Percentage Change Calculation**:
- **Gold Program**: `(1925 - 1131) / 1131 = 794 / 1131 ≈ 0.70203` (70.203%).
- **ZS-STD LLM**: States a $794 million increase (1925 - 1131), which is `794 / 1131 ≈ 69.7%`.
- **ZS-CoT**: Reports `70.1%`, likely due to rounding differences (e.g., intermediate steps preserved more decimal places).
### Key Observations
1. **Discrepancy in Answers**:
- The Gold Program and ZS-CoT answers differ slightly (70.203% vs. 70.1%), likely due to rounding.
- The ZS-STD LLM answer (69.7%) uses the same $794 million increase but rounds differently.
2. **Cash Flow Trend**:
- Cash flows from operations increased by **$794 million** from 2015 to 2016, representing a **~70% increase**.
- 2014 cash flows ($1,165 million) were slightly higher than 2015 ($1,131 million), indicating a dip in 2015 before a significant rebound in 2016.
### Interpretation
- **Financial Health**: The 70%+ increase in cash flows from operations (2015–2016) suggests strong operational performance in 2016, potentially driven by improved revenue or cost management.
- **Obligations Structure**: The majority of obligations ($7,385 million) are long-term (>5 years), indicating a focus on sustained financing. Short-term obligations are minimal ($1,068 million), reducing liquidity risk.
- **Calculation Nuance**: The slight differences in percentage answers highlight the importance of precision in financial reporting. The ZS-CoT method retains more decimal places during intermediate steps, leading to a marginally higher result (70.1% vs. 69.7%).
- **Anomaly**: The 2014 cash flow ($1,165 million) being higher than 2015 ($1,131 million) warrants investigation into operational challenges in 2015.
## Conclusion
The document underscores a significant year-over-year improvement in cash flows from operations in 2016, with minor discrepancies in automated calculations likely stemming from rounding practices. The obligations table reveals a long-term financing strategy, with short-term liabilities comprising only ~7% of total obligations.