## 3D Scatter Plot: Sphere
### Overview
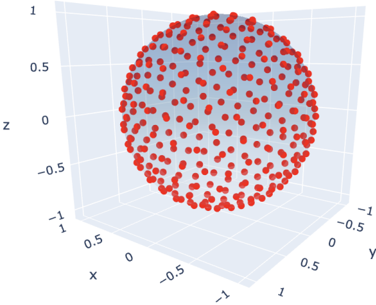
The image is a 3D scatter plot displaying points arranged in a spherical shape. The plot has three axes labeled x, y, and z, ranging from -1 to 1. Red dots represent the data points forming the sphere.
### Components/Axes
* **X-axis:** Ranges from -1 to 1.
* **Y-axis:** Ranges from -1 to 1.
* **Z-axis:** Ranges from -1 to 1.
* **Data Points:** Red dots scattered to form a sphere.
### Detailed Analysis
The red data points are distributed to create a spherical shape centered around the origin (0, 0, 0). The density of points appears relatively uniform across the surface of the sphere.
* **X-axis:** The x-axis ranges from -1 to 1, with markers at -1, -0.5, 0, 0.5, and 1.
* **Y-axis:** The y-axis ranges from -1 to 1, with markers at -1, -0.5, 0, 0.5, and 1.
* **Z-axis:** The z-axis ranges from -1 to 1, with markers at -1, -0.5, 0, 0.5, and 1.
### Key Observations
* The data points form a sphere.
* The sphere is centered at the origin (0, 0, 0).
* The points are distributed relatively uniformly.
### Interpretation
The 3D scatter plot visualizes a spherical distribution of data points. This type of visualization can be used to represent various phenomena, such as the distribution of particles in a physical system, the spread of data in a three-dimensional space, or the representation of a mathematical function. The uniform distribution suggests that the points are evenly spread across the surface of the sphere.