\n
## 3D Scatter Plot: Spherical Data Distribution
### Overview
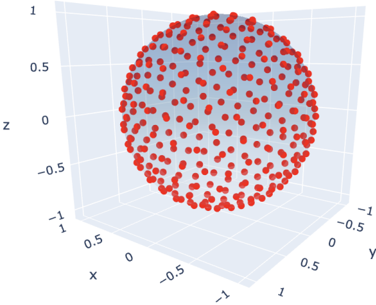
The image depicts a 3D scatter plot showing a roughly spherical distribution of data points. The points are clustered within a sphere centered approximately at the origin. The plot uses a Cartesian coordinate system with X, Y, and Z axes.
### Components/Axes
* **X-axis:** Labeled "x", ranging from approximately -1 to 1.
* **Y-axis:** Labeled "y", ranging from approximately -1 to 1.
* **Z-axis:** Labeled "z", ranging from approximately -0.5 to 1.
* **Data Points:** Red circular markers representing individual data points.
* **Coordinate System:** A 3D Cartesian coordinate system with the origin at (0, 0, 0).
### Detailed Analysis
The data points appear to be distributed within a sphere of approximately radius 1, centered around the origin. The density of points appears relatively uniform throughout the sphere, though there may be a slight concentration towards the positive Z-axis.
The points are distributed as follows (approximate values based on visual estimation):
* **X-values:** Range from approximately -0.9 to 0.9.
* **Y-values:** Range from approximately -0.9 to 0.9.
* **Z-values:** Range from approximately -0.5 to 0.9.
There is no explicit legend or color coding beyond the red data points. The plot does not contain any lines, curves, or other visual elements besides the scatter points and axes.
### Key Observations
* The data exhibits a spherical symmetry.
* The distribution appears to be relatively uniform within the sphere.
* The Z-axis range is slightly shorter than the X and Y axes.
### Interpretation
The data suggests a random or uniform distribution of points within a three-dimensional spherical volume. This could represent a variety of phenomena, such as:
* **Random Sampling:** The points could be the result of randomly sampling from a uniform distribution within a sphere.
* **Isotropic Process:** The data might represent a physical process that is isotropic (i.e., behaves the same in all directions).
* **Simulation Data:** The points could be generated by a simulation that models a spherical system.
The slight asymmetry in the Z-axis range could indicate a minor bias in the data generation process or a limitation of the visualization. Without additional information about the source of the data, it is difficult to draw more specific conclusions. The data does not contain any explicit numerical values or statistical measures, so the interpretation is based solely on the visual pattern of the scatter plot.