## 3D Scatter Plot: Points on a Unit Sphere
### Overview
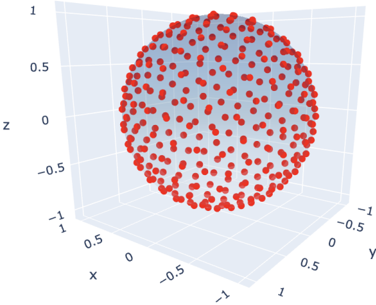
The image displays a three-dimensional scatter plot rendered within a cubic coordinate system. The primary visual element is a dense collection of red data points that collectively form the surface of a sphere. The plot is presented from an isometric perspective, allowing a clear view of the spherical structure within the 3D space.
### Components/Axes
* **Coordinate System:** A 3D Cartesian coordinate system with three orthogonal axes.
* **Axis Labels:**
* **X-axis:** Labeled "x". The axis runs horizontally from left to right in the foreground.
* **Y-axis:** Labeled "y". The axis recedes into the background from left to right.
* **Z-axis:** Labeled "z". The axis runs vertically.
* **Axis Scales & Markers:**
* All three axes (x, y, z) share the same scale, ranging from **-1 to 1**.
* Major tick marks and numerical labels are present at intervals of **0.5**: `-1, -0.5, 0, 0.5, 1`.
* **Data Series:**
* A single data series is plotted, represented by **red circular markers**.
* There is **no legend** present in the image. The color assignment is implicit for the sole dataset.
* **Grid:** A faint, light-gray grid is visible on the three back planes of the cubic bounding box, aiding in spatial orientation.
### Detailed Analysis
* **Data Distribution:** The red data points are distributed with apparent uniformity across the **surface of a sphere**. The sphere appears to be centered at the origin (0, 0, 0) of the coordinate system.
* **Radius:** The sphere's surface aligns with the **±1 markers** on all three axes, indicating it is a **unit sphere** (radius = 1).
* **Density:** The points are densely packed, suggesting a large sample size (likely several hundred points). The distribution shows no obvious clustering or gaps on the spherical shell.
* **Spatial Grounding:** The spherical structure is centered within the plot volume. Points are visible on the "front" (facing the viewer), "top", and "right" sides of the sphere, confirming its 3D nature. The perspective causes points on the far side to be occluded.
### Key Observations
1. **Perfect Spherical Form:** The most striking observation is the precise spherical geometry formed by the data points. This is not a cloud but a well-defined shell.
2. **Uniform Surface Distribution:** The points appear to be sampled evenly across the spherical surface, with no visible bias toward any particular region (e.g., poles vs. equator).
3. **Unit Radius:** The sphere's boundary perfectly matches the ±1 limits of the axes, confirming its mathematical definition as a unit sphere.
4. **Single Dataset:** The visualization contains only one set of data, rendered in a single color (red).
### Interpretation
This image is a technical visualization of **points sampled from the surface of a unit sphere in 3D space**. It is not a chart of experimental data with trends over time or categories, but rather a geometric representation.
* **What it Demonstrates:** The plot visually confirms a set of coordinates `(x, y, z)` that all satisfy the equation `x² + y² + z² = 1`. This is a fundamental object in mathematics, physics, and computer science.
* **Potential Contexts:** Such a visualization could be used to:
* Illustrate spherical coordinates or uniform sampling on a sphere.
* Represent directional data (e.g., orientations, unit vectors).
* Serve as a test case for 3D rendering or point cloud algorithms.
* Visualize the output of a process that generates points on a spherical manifold.
* **Notable Absence:** The lack of a title or legend suggests this is likely a generated figure from a computational environment (like Python's Matplotlib or similar) used for demonstration or analysis, rather than a finalized chart for a publication. The information is purely geometric; no external variables or measurements are encoded beyond the spatial coordinates.