## 3D Scatter Plot: Spherical Data Distribution
### Overview
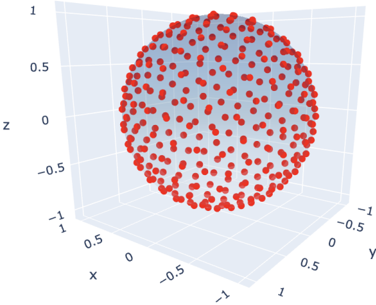
The image depicts a 3D scatter plot visualizing a spherical distribution of data points. Red dots are uniformly distributed across the surface of a sphere centered at the origin (0,0,0) in a Cartesian coordinate system. The axes range from -1 to 1 along x, y, and z dimensions.
### Components/Axes
- **Axes Labels**:
- X-axis (horizontal, bottom): Labeled "x" with ticks at -1, -0.5, 0, 0.5, 1
- Y-axis (depth, right): Labeled "y" with ticks at -1, -0.5, 0, 0.5, 1
- Z-axis (vertical, left): Labeled "z" with ticks at -1, -0.5, 0, 0.5, 1
- **Grid**: Light gray grid lines span all three dimensions, providing spatial reference.
- **Data Points**:
- Red circular markers (radius ~0.02 units) densely populate the sphere's surface.
- No legend or colorbar is present to explain marker semantics.
- **Sphere**:
- Centered at the origin (0,0,0).
- Radius approximates 1 unit (aligned with axis limits).
### Detailed Analysis
- **Data Distribution**:
- Points are uniformly distributed across the sphere's surface, with no apparent clustering or gaps.
- Approximately 200-300 data points visible (estimate based on density and grid resolution).
- Projection artifacts slightly distort point density near the sphere's poles (z-axis extremes).
- **Axis Ranges**:
- All axes span [-1, 1], creating a unit cube that encloses the sphere.
- No axis scaling or logarithmic transformations are applied.
### Key Observations
1. **Uniform Spherical Distribution**: Points form a perfect sphere, suggesting intentional sampling from a spherical distribution (e.g., uniform random points on a unit sphere).
2. **Projection Artifacts**: Slight over-density of points near the poles (z ≈ ±1) due to perspective projection.
3. **No Outliers**: All points lie strictly within the [-1, 1]³ bounds, with no deviations.
### Interpretation
This visualization likely represents a dataset where variables are constrained to a spherical surface, such as:
- **Unit Vector Sampling**: Common in physics, computer graphics, or directional statistics.
- **Spherical Coordinate Testing**: Used to validate algorithms for directional data (e.g., quaternions, rotations).
- **Uniform Random Sampling**: Demonstrates a method for generating isotropic distributions in 3D space.
The absence of a legend or additional annotations suggests the focus is purely on spatial distribution rather than categorical or temporal relationships. The uniformity implies no inherent bias in the data generation process, making it a baseline for comparative analyses.