## Diagram: 3D System Evolution with State Transitions
### Overview
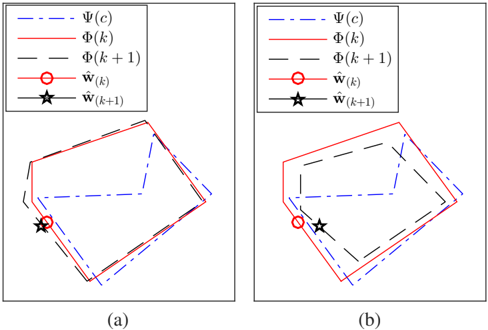
The image contains two 3D diagrams (a) and (b) illustrating the evolution of a system with state transitions. Both diagrams use color-coded lines and markers to represent mathematical functions and states. The diagrams share a consistent legend but differ in the spatial arrangement of elements.
### Components/Axes
- **Axes**: Implicit 3D coordinate system (x, y, z) with no explicit labels.
- **Legend**: Located in the top-left corner of both diagrams.
- **Ψ(c)**: Blue dashed line (constant horizontal line at the top).
- **Φ(k)**: Red solid line (primary trajectory).
- **Φ(k+1)**: Black dashed line (shifted trajectory).
- **ẑ(k)**: Red circle with a line through it (initial state).
- **ẑ(k+1)**: Black star (final state).
### Detailed Analysis
#### Diagram (a)
- **Φ(k)**: Red solid line starts at the bottom-left, ascends to the top-right, then descends to the bottom-right, forming a peak.
- **Φ(k+1)**: Black dashed line mirrors Φ(k) but is shifted slightly upward and to the right.
- **Ψ(c)**: Blue dashed line remains a constant horizontal boundary at the top.
- **ẑ(k)**: Red circle with a line through it is positioned at the bottom-left corner.
- **ẑ(k+1)**: Black star is placed at the bottom-right corner.
#### Diagram (b)
- **Φ(k)**: Red solid line starts at the bottom-left, ascends to the top-right, then descends to the bottom-right, but with a steeper slope compared to (a).
- **Φ(k+1)**: Black dashed line follows a similar path to Φ(k) but is shifted further upward and to the right.
- **Ψ(c)**: Blue dashed line remains unchanged as a horizontal boundary.
- **ẑ(k)**: Red circle with a line through it is at the bottom-left, but closer to the red line.
- **ẑ(k+1)**: Black star is at the bottom-right, aligned with the black dashed line.
### Key Observations
1. **State Transitions**: The red circle (ẑ(k)) and black star (ẑ(k+1)) represent initial and final states, respectively. Their positions shift from (a) to (b), suggesting a progression.
2. **Function Evolution**: Φ(k) and Φ(k+1) show similar trajectories but with increased amplitude and shift in (b), indicating a dynamic system.
3. **Boundary Constraint**: Ψ(c) acts as a fixed upper limit for both diagrams.
4. **Spatial Relationships**: In (a), ẑ(k) and ẑ(k+1) are at opposite corners, while in (b), they align more closely with their respective Φ lines.
### Interpretation
The diagrams likely model a system where Φ(k) represents a function or state at iteration *k*, and Φ(k+1) its evolution at *k+1*. The shift between Φ(k) and Φ(k+1) suggests iterative refinement or adaptation. The constant Ψ(c) may represent a physical or theoretical boundary (e.g., energy limit, stability threshold). The markers ẑ(k) and ẑ(k+1) could denote critical points (e.g., equilibrium states) that transition spatially as the system evolves. Diagram (b) implies a more pronounced change or optimization compared to (a), possibly due to altered parameters or constraints.