## Diagram: Shape Approximation
### Overview
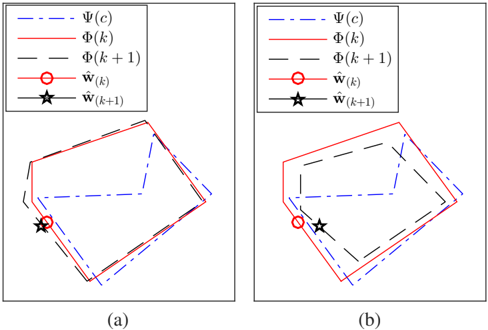
The image shows two diagrams, labeled (a) and (b), illustrating the approximation of a shape using iterative methods. Each diagram contains three shapes: a blue dashed line representing Ψ(c), a red solid line representing Φ(k), and a black dashed line representing Φ(k+1). Additionally, each diagram includes a red circle marker representing w^(k) and a black star marker representing w^(k+1). The diagrams show how the shape Φ is updated from iteration k to k+1, converging towards the shape Ψ.
### Components/Axes
* **Shapes:**
* Ψ(c): Represented by a blue dashed line.
* Φ(k): Represented by a red solid line.
* Φ(k+1): Represented by a black dashed line.
* **Markers:**
* w^(k): Represented by a red circle.
* w^(k+1): Represented by a black star.
* **Labels:**
* (a): Label for the left diagram.
* (b): Label for the right diagram.
* **Legend (Top-Left of each diagram):**
* Blue dashed line: Ψ(c)
* Red solid line: Φ(k)
* Black dashed line: Φ(k+1)
* Red circle: w^(k)
* Black star: w^(k+1)
### Detailed Analysis
**Diagram (a):**
* The blue dashed line Ψ(c) forms an irregular polygon.
* The red solid line Φ(k) is a polygon that approximates Ψ(c).
* The black dashed line Φ(k+1) is a polygon that is closer to Ψ(c) than Φ(k).
* The red circle w^(k) is located on the lower-left side of the shape.
* The black star w^(k+1) is located very close to the red circle w^(k), slightly below and to the right.
**Diagram (b):**
* The blue dashed line Ψ(c) forms an irregular polygon.
* The red solid line Φ(k) is a polygon that approximates Ψ(c).
* The black dashed line Φ(k+1) is a polygon that is closer to Ψ(c) than Φ(k).
* The red circle w^(k) is located on the lower-left side of the shape.
* The black star w^(k+1) is located very close to the red circle w^(k), slightly to the right.
### Key Observations
* In both diagrams, Φ(k+1) is a better approximation of Ψ(c) than Φ(k).
* The markers w^(k) and w^(k+1) are located close to each other, indicating a small adjustment in the iterative process.
* The shapes in diagram (b) appear to be slightly rotated compared to diagram (a).
### Interpretation
The diagrams illustrate an iterative process for approximating a shape (Ψ(c)) using successive approximations (Φ(k) and Φ(k+1)). The markers w^(k) and w^(k+1) likely represent control points or parameters that are adjusted in each iteration to improve the approximation. The fact that Φ(k+1) is closer to Ψ(c) than Φ(k) suggests that the iterative process is converging towards the target shape. The slight rotation of the shapes in diagram (b) compared to diagram (a) could indicate a different starting point or a different set of parameters for the iterative process.