## Scatter Plot: Reasoning Tokens vs. Problem Size
### Overview
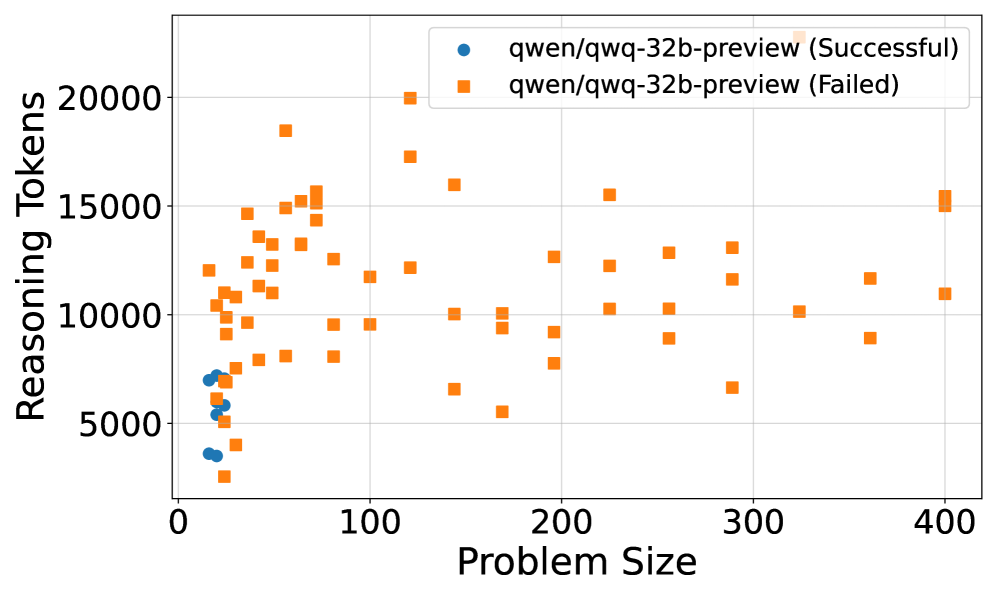
This image presents a scatter plot visualizing the relationship between "Problem Size" and "Reasoning Tokens" for a model named "qwen/qwq-32b-preview". The data points are color-coded to distinguish between successful and failed attempts.
### Components/Axes
* **X-axis:** "Problem Size" - Scale ranges from approximately 0 to 400, with tick marks at intervals of 100.
* **Y-axis:** "Reasoning Tokens" - Scale ranges from approximately 0 to 20000, with tick marks at intervals of 5000.
* **Legend:** Located in the top-right corner.
* Blue circles: "qwen/qwq-32b-preview (Successful)"
* Orange squares: "qwen/qwq-32b-preview (Failed)"
* **Gridlines:** Present to aid in reading values.
### Detailed Analysis
The plot shows two distinct data series: one for successful attempts (blue circles) and one for failed attempts (orange squares).
**Successful Attempts (Blue Circles):**
The successful attempts are concentrated in the lower-left portion of the plot. The trend is relatively flat, with a slight upward slope.
* At Problem Size ≈ 0, Reasoning Tokens range from approximately 2000 to 6000.
* At Problem Size ≈ 50, Reasoning Tokens range from approximately 3000 to 7000.
* At Problem Size ≈ 100, Reasoning Tokens range from approximately 4000 to 6000.
* At Problem Size ≈ 200, Reasoning Tokens range from approximately 4000 to 7000.
* At Problem Size ≈ 300, Reasoning Tokens range from approximately 5000 to 7000.
* At Problem Size ≈ 400, Reasoning Tokens range from approximately 6000 to 8000.
**Failed Attempts (Orange Squares):**
The failed attempts are more dispersed throughout the plot, with a higher concentration in the upper-left and center regions. The trend is more variable.
* At Problem Size ≈ 0, Reasoning Tokens range from approximately 2000 to 12000.
* At Problem Size ≈ 50, Reasoning Tokens range from approximately 5000 to 16000.
* At Problem Size ≈ 100, Reasoning Tokens range from approximately 6000 to 20000.
* At Problem Size ≈ 150, Reasoning Tokens range from approximately 5000 to 13000.
* At Problem Size ≈ 200, Reasoning Tokens range from approximately 5000 to 11000.
* At Problem Size ≈ 300, Reasoning Tokens range from approximately 6000 to 12000.
* At Problem Size ≈ 400, Reasoning Tokens range from approximately 8000 to 15000.
### Key Observations
* Successful attempts generally require fewer reasoning tokens than failed attempts.
* The number of reasoning tokens required for successful attempts appears to increase slightly with problem size, but the increase is relatively small.
* Failed attempts exhibit a wider range of reasoning token usage, suggesting more variability in the model's performance on challenging problems.
* There is a cluster of failed attempts with very high reasoning token counts (above 15000) even for relatively small problem sizes.
### Interpretation
The data suggests that the "qwen/qwq-32b-preview" model is more likely to succeed when the problem size is smaller and the number of reasoning tokens required is lower. The wide range of reasoning token usage for failed attempts indicates that the model sometimes struggles with problems that require more extensive reasoning, even if the problem size is not particularly large. The presence of failed attempts with high reasoning token counts suggests that the model can get "stuck" in a reasoning loop without reaching a solution. This could be due to issues with the model's architecture, training data, or decoding strategy. The relatively flat trend for successful attempts suggests that the model's reasoning efficiency does not significantly degrade as the problem size increases, at least within the observed range. Further investigation could explore the characteristics of the problems that lead to high reasoning token counts and failures, and identify potential strategies for improving the model's performance on these challenging cases.