## Scatter Plot: Reasoning Tokens vs Problem Size for qwen/qwq-32b-preview
### Overview
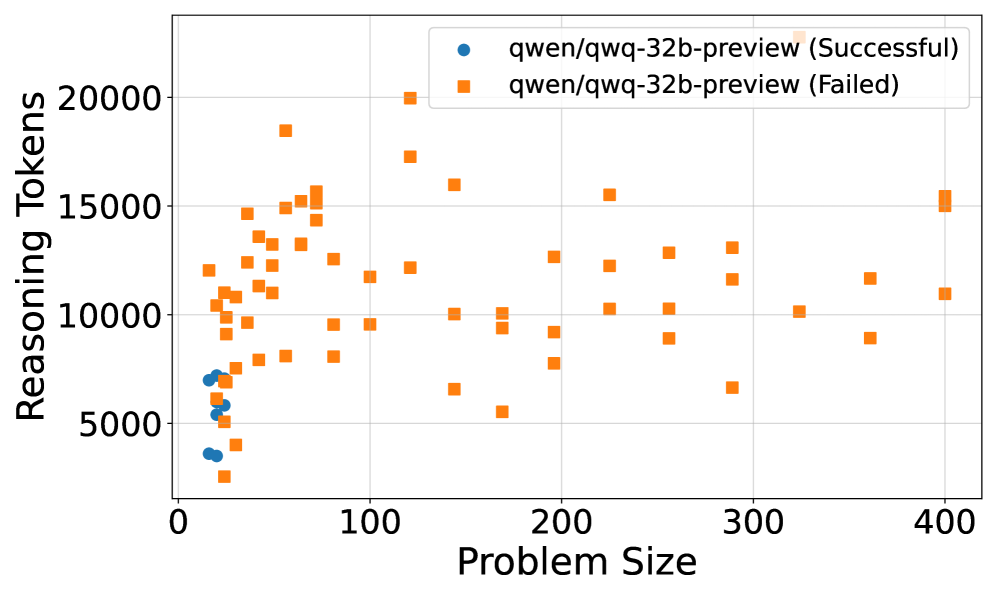
The image shows a scatter plot comparing reasoning token usage against problem size for two categories of outcomes: successful and failed runs of the qwen/qwq-32b-preview model. The plot uses distinct markers (blue circles for successful, orange squares for failed) to differentiate outcomes across problem sizes from 0 to 400.
### Components/Axes
- **X-axis (Problem Size)**:
- Range: 0 to 400
- Increment: 100
- Label: "Problem Size"
- **Y-axis (Reasoning Tokens)**:
- Range: 0 to 20,000
- Increment: 5,000
- Label: "Reasoning Tokens"
- **Legend**:
- Position: Top-right corner
- Entries:
- Blue circles: "qwen/qwq-32b-preview (Successful)"
- Orange squares: "qwen/qwq-32b-preview (Failed)"
### Detailed Analysis
- **Successful Runs (Blue Circles)**:
- Concentrated in the lower-left quadrant (Problem Size: 0–100, Reasoning Tokens: 3,000–7,000).
- No data points observed beyond Problem Size 100.
- Clustered tightly, suggesting consistent token usage for smaller problems.
- **Failed Runs (Orange Squares)**:
- Distributed across the entire Problem Size range (0–400).
- Token usage spans 3,000–20,000, with a notable outlier at (400, 20,000).
- Higher density of points in the 100–300 Problem Size range (Tokens: 8,000–15,000).
### Key Observations
1. **Problem Size Correlation**:
- Successful runs cluster at smaller problem sizes (≤100), while failed runs span all sizes.
- Token usage increases with problem size for failed cases, peaking at 20,000 tokens for Problem Size 400.
2. **Outlier**:
- A single failed run at (400, 20,000) represents the maximum token usage observed.
3. **Efficiency Gap**:
- Successful runs use ≤7,000 tokens, while failed runs often exceed this threshold, especially at larger problem sizes.
### Interpretation
The data suggests that problem size significantly impacts both success rates and token efficiency. Successful runs are confined to smaller problem sizes and exhibit lower token consumption, indicating the model's capacity limits. Failed runs show a clear trend of increasing token usage with problem size, culminating in the outlier at Problem Size 400. This outlier may represent an edge case where the model expended maximum resources but still failed, highlighting potential scalability challenges. The stark contrast between successful and failed runs implies that token efficiency is a critical factor in determining task success, with larger problem sizes correlating with higher computational demands and lower success rates.